The following numbers 3.5, 8.5, 10.5, 20.9, 10.6 all have one thing in common. They are different ways of measuring the 2008 divorce rate in the US. Perhaps no single measure of family life is so often incorrectly reported and misunderstood.
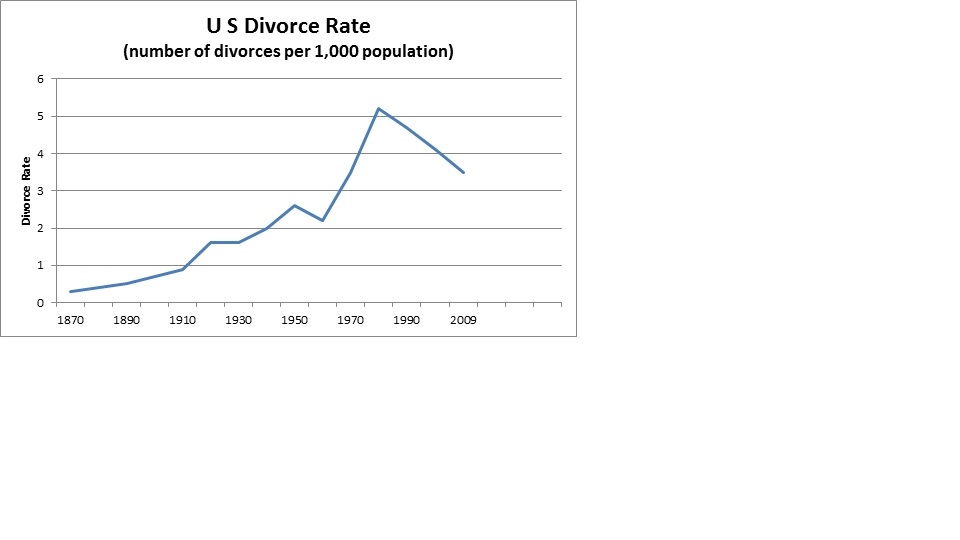
Crude divorce rate from the National Center on Health Statistics. Beginning in 1867, the United States government began reporting the divorced rate based on the number of divorces per 1000 members of the US population. In 2008, this number which has become known as the crude divorce rate was 3.5. In the figure below you can see the crude US divorce rate over the past 140+ years.
One of the problems with this measure of the divorce rate is that by using the total population as the base it includes children and unmarried adults which may distort the results. The other problem is that in recent years several states discontinued reporting divorces and so in the last 10 years, these "missing" state numbers may be distorting the overall national profile.
Crude divorce rate as estimated by the American Community Survey by the U.S. Census Bureau. Because of the reporting problems with the crude divorce rate, the US Census Bureau began conducting the American Community Survey in order to get a better estimate of the divorce rate. Their estimate of the crude divorce rate in 2008 was 8.5 divorces per 1000 members of the US population. This number suggests that the divorce rate overall may be twice as large as the estimates by the National Center for Health Statistics.
Divorces per adult population as estimated by the American Community Survey by the U.S. Census Bureau. The crude divorce rate is still based on the total population which includes children which obviously cannot get married much less get divorced, so if we exclude them from the estimate, we get a divorce rate of 10.5 divorces per 1000 members of the population who are over 15 years of age. But this number still includes all unmarried members of the population. On average, the number of people who are unmarried has been increasing over the last 30 years so this may also distort the divorce rate.
Divorces per married adult population as estimated by the American Community Survey by the U.S. Census Bureau. To estimate the divorce rate using only adults over 15 who are married, you get a divorce rate of 20.9 divorces. This may be the best overall estimate of the "divorce rate." But this still seems a like an abstract number without much meaning.
Percentage of US population in 2008 who were divorced. A number that is more meaningful is the percentage of the population in any year that is divorced, that is, neither unmarried nor married. In 2008, 10.6% of the population was divorced. The percentage who were married was 50.2%, separated was 2.2%, and the percentage of never married adults was 30.8%. The percentage of married individuals includes those who are remarried. It is also interesting to note that in 2001 it was estimated that 21% of men and 23% of women over 15 years of age had ever been divorced.
So what does all this mean? The best measure of the divorce rate is based on the number of divorces per married people over 15 years of age. Often this number is not readily available or reported which creates puzzling and confusing discussions. The American Community Survey (http://www.census.gov/acs/www/ ) is the best source of data on the divorce rate and should be used to understand trends in American family life. To understand the real divorce rate in American society it is important that we use a reliable and valid measure.