
Polls released in the second half of the week generally suggested a slight uptick in Obama support, in the national popular vote, battleground states and the Electoral College forecast.
Recent runs of my poll-averaging model show Obama faring slightly better in the national popular vote. Obama has a 0.5 percentage point lead over Romney (47.6 to 47.1). Two relevant factors: a large poll Internet poll from Ipsos (the likely voter sample size is almost 5,000) showing a one point lead for Obama entered the Pollster database this morning; Gallup's tracking has been down since Sandy hit the East Coast, and Pollster readers will recall that Gallup was showing sizeable leads for Romney with quite large weekly sample sizes (2,700 LVs). My model is designed to deal with vagaries such as pollsters entering and exiting the data stream and uneven sample sizes across polls. Nonetheless, the Ipsos sample size is unusually large and worth noting.
It is important to remember that these differences in Obama and Romney support levels are small relative to the uncertainty accompanying the estimates. Even with as much polling data as we have at this stage of the campaign, margins of error and confidence intervals around these point estimates aren't shrinking to the point where we can confidently distinguish 47.6 from 47.1 (the latest Obama estimate vs the latest Romney estimate). That is, the probability that Obama actually leads Romney is around 70 percent.
In recent days I've talked about translating the Pollster model-based, poll average into an election forecast. This involves relaxing some of the assumptions in the poll averaging model, inducing an extra source of uncertainty into the mix (since historical data indicates that poll averages don't always hit the actual election outcome, but generally perform not too badly in close elections).
The graph below contrasts probabilities of Obama "leads" from the poll averaging model (left column) and the probabilities of Obama "wins" when we map the poll average estimates into a forecast (right column). Forecasts pick up an extra dollop of uncertainty and so the probabilities "shrink" towards 50-50. This graph is based on estimates computed overnight and might not exactly match what we are reporting on the Pollster Dashboard right now.
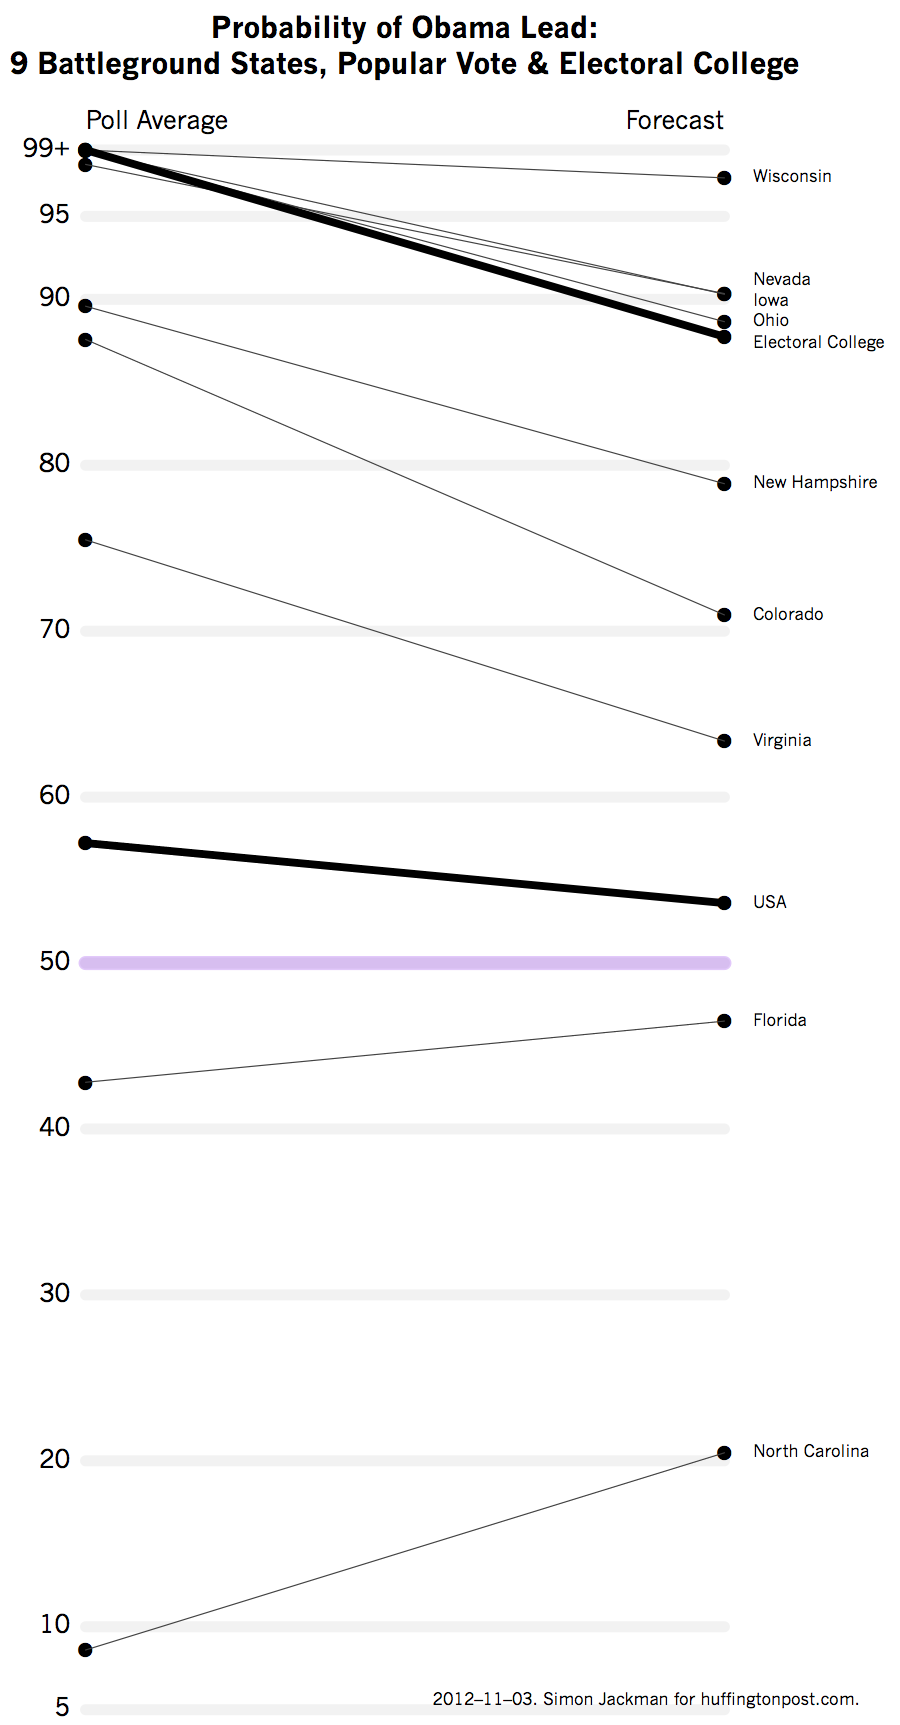
Seven out of the nine swing states we're watching most closely are estimated to be more likely to fall to Obama than Romney. North Carolina appears to be Romney's best chance of a win among the states considered here (just a 20 percent chance of an Obama win). Florida is almost a 50-50 proposition.
Virginia has shifted favorably for Obama in the last few days, up to almost a 2/3 chance of being won by Obama from 50-50 territory in the past few days. Obama's chance in other battleground states like Colorado, New Hampshire, Iowa and Nevada have moved up as well. Nevada and Iowa currently sit on 90 percent forecast probabilities for Obama. Wisconsin looks quite solid for Obama, with a win probability above 95 percent.
Ohio has always looked reasonably safe for Obama all year. The probability that Obama wins Ohio is almost 90 percent, and not coincidentally, just a tad above the probability that Obama wins the Electoral College (87.8 percent).
Twitter followers have been asking to see the distribution of Electoral College outcomes implied by our state-by-state forecasts (and critically, the uncertainty in the Electoral College outcomes implied by the uncertainty in the state-by-state forecasts). The probability reported above is simply the proportion of simulated Electoral College outcomes in which Obama received 270 or more Electoral College votes.
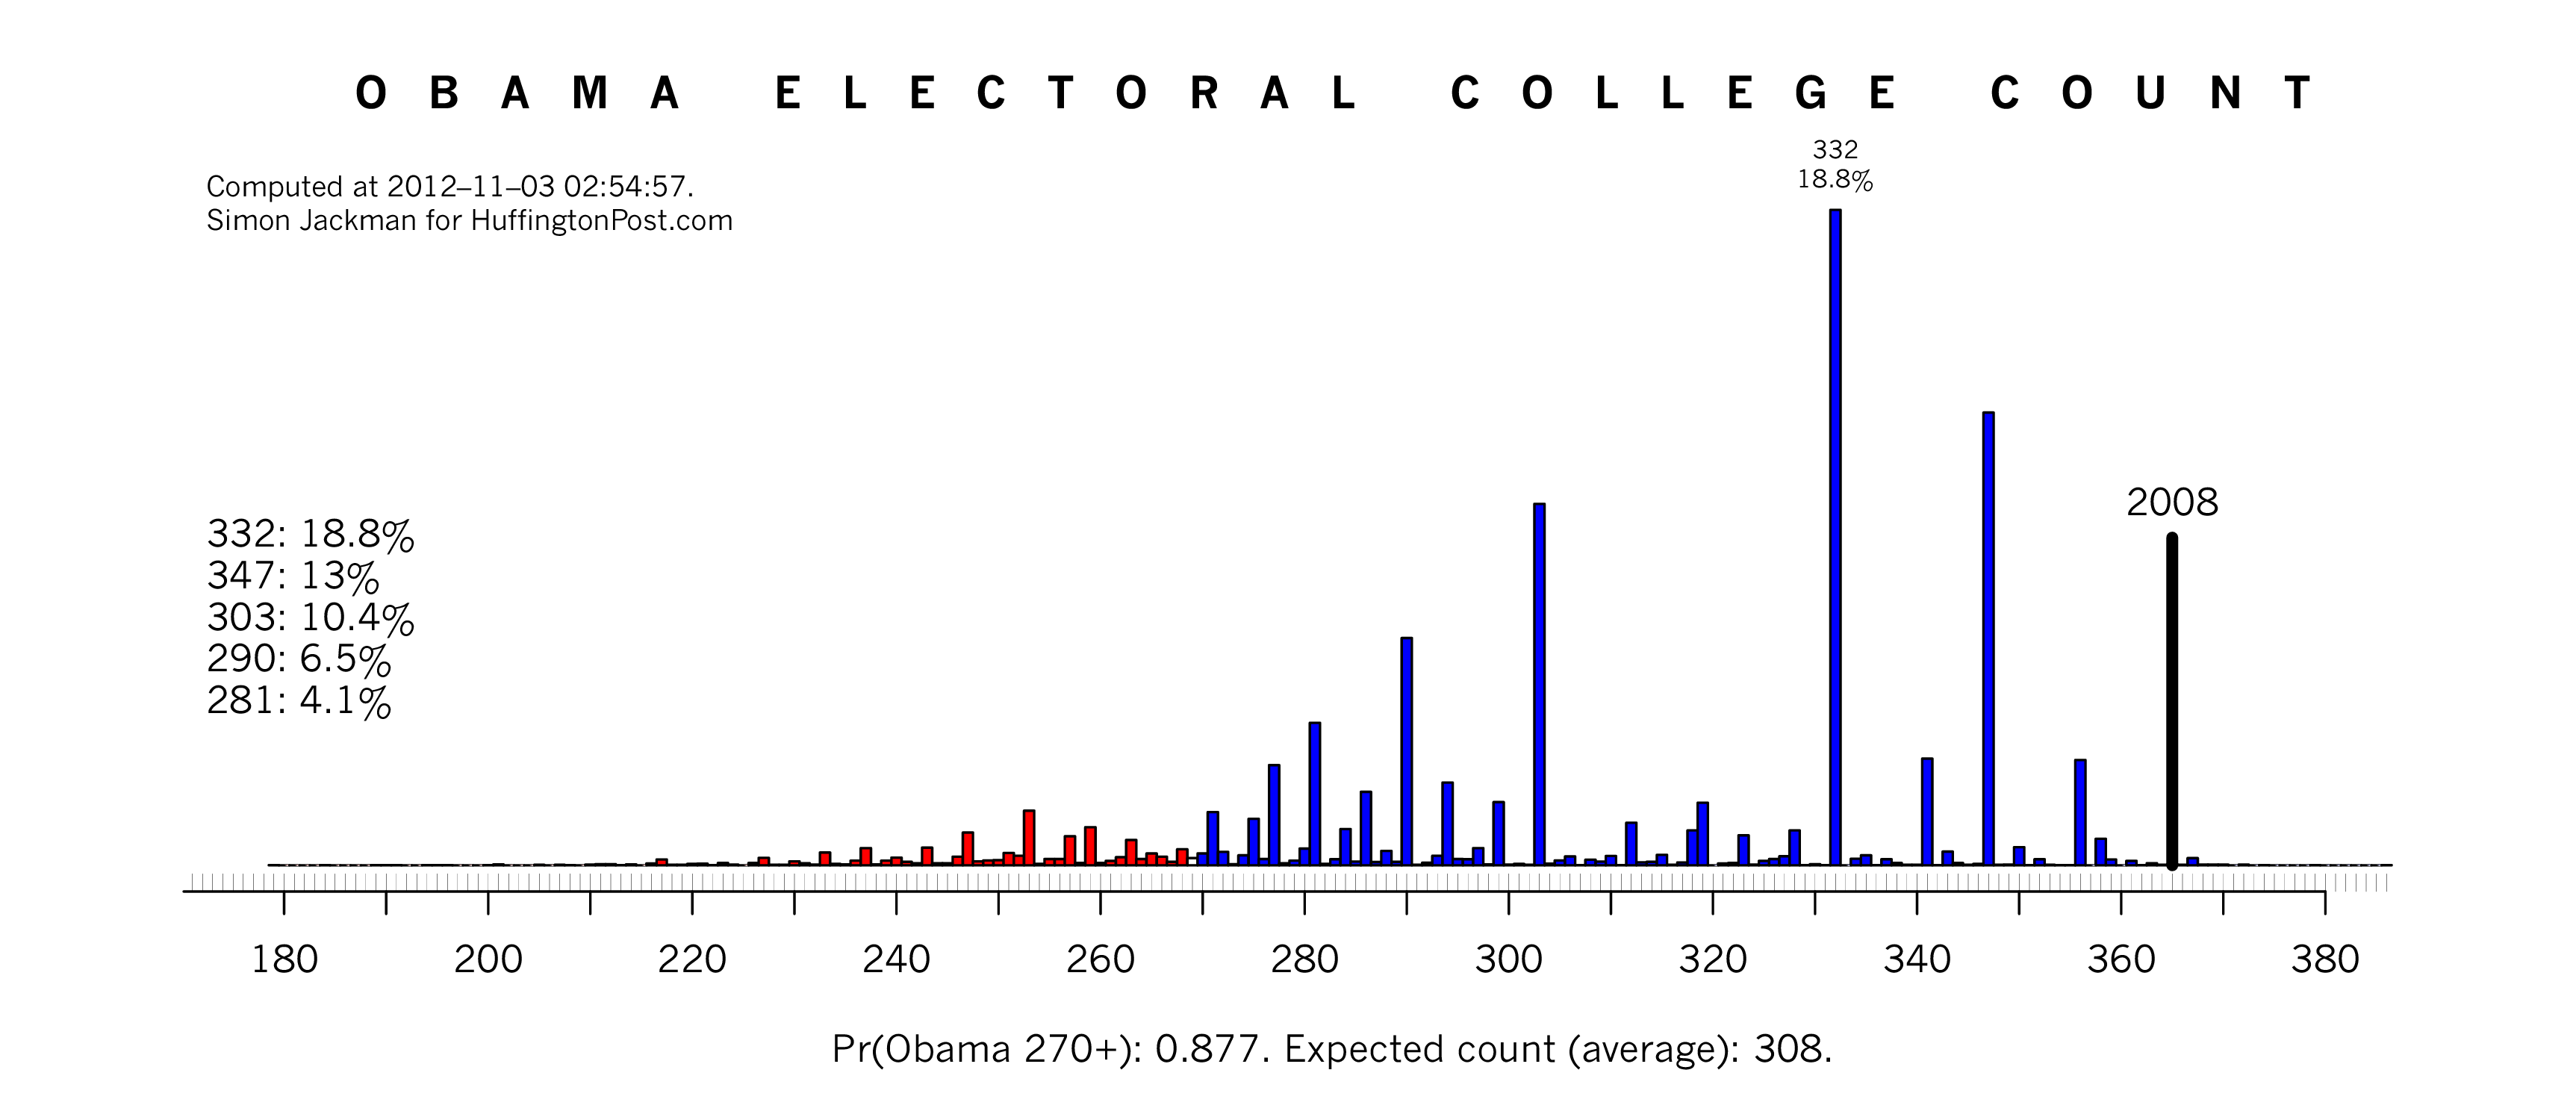
The distribution itself appears in the histogram (above). Blue bars indicate Obama wins; red bars are Romney wins; a small white bar appears at 270. Averaged over the distribution, the expected Obama outcome is 308 (although the probability of exactly 308 is virtually zero). The single most likely outcome is 332 (19 percent), followed by 347, 303 and 290. Together, these four outcomes account for about half of all the simulated Electoral College outcomes.
The 332 Obama outcome arises with the extent of Romney's gains confined to Indiana and North Carolina (along with Romney sweeping Nebraska). 347 arises if North Carolina stays with Obama (leaving Indiana as Romney's only pickup), 303 if Romney also wins Florida. Obama's EV count falls to 290 if Romney takes the three tightest swing states (FL, NC and Virginia, along with Indiana).
At this stage the importance of Ohio's 18 EVs to Romney's chances becomes quite clear. In addition to taking Indiana, North Carolina, Florida and Virginia from Obama's 2008 haul, Romney could take Colorado (9 EVs), Iowa (6) and New Hampshire (4) and still come up short, with 267 EVs. Of course, my modeling indicates that the probability of Romney doing this well (or even better and winning the election) is somewhat unlikely, less than 13 percent.