
Here's some of what's being said about this campaign -- from a public opinion perspective -- as we enter its final few days: Gallup leans too Republican. Ohio and Iowa polls have too many Democrats. Obama can't be winning if Independents are going with Romney by double digits. The national numbers and the state polls are telling two different stories. All of the above are probably true. But instead of creating confusion, our sense is that it's leading to some clarity. With five days to go before the election, it is now pretty clear that -- barring a destabilizing external event -- Mitt Romney will likely win the national popular vote for president. The only remaining question is whether the president's Midwest firewall will hold and give him an Electoral College victory.
More than anything else, we strongly believe in three predictive indicators, all of which suggest that the president will lose the popular vote. First is his current vote share, which stands at approximately 47-47.5 percent. Incumbents rarely improve on their final poll numbers by more than one or two points, putting Obama at approximately 48-49 percent on Election Day.
Second, Romney has more than a 10-point lead among Independents nationally and in most key swing states. Our average of national polls fielded over the last two weeks shows Romney with a 14-point lead among Independents. For context, that's a full six points better than Obama's eight-point advantage over McCain in 2008. The Ohio poll average shows Romney with an eight-point lead among Independents. The only outlier in the below chart is Kerry's 19-point win among Independents in 2004 (something that may be attributable to "quirky" exits that year).
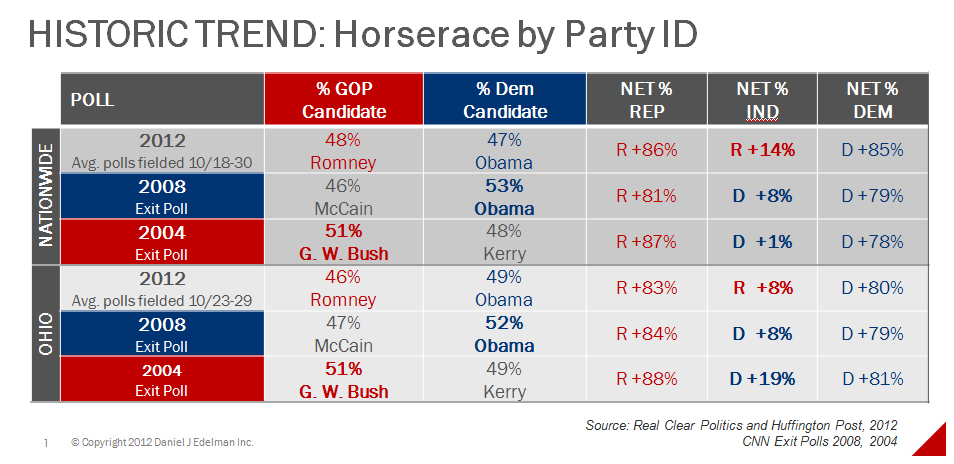
It is highly unlikely that the president can win this election if he is losing Independents by double digits. And there aren't any indicators suggesting that Democrat turnout will be large enough to compensate for that.
Which leads to the third point: voter enthusiasm and energy is with the GOP. A recent Pew poll had Republicans with a 14-point lead over Democrats in terms of vote likelihood.
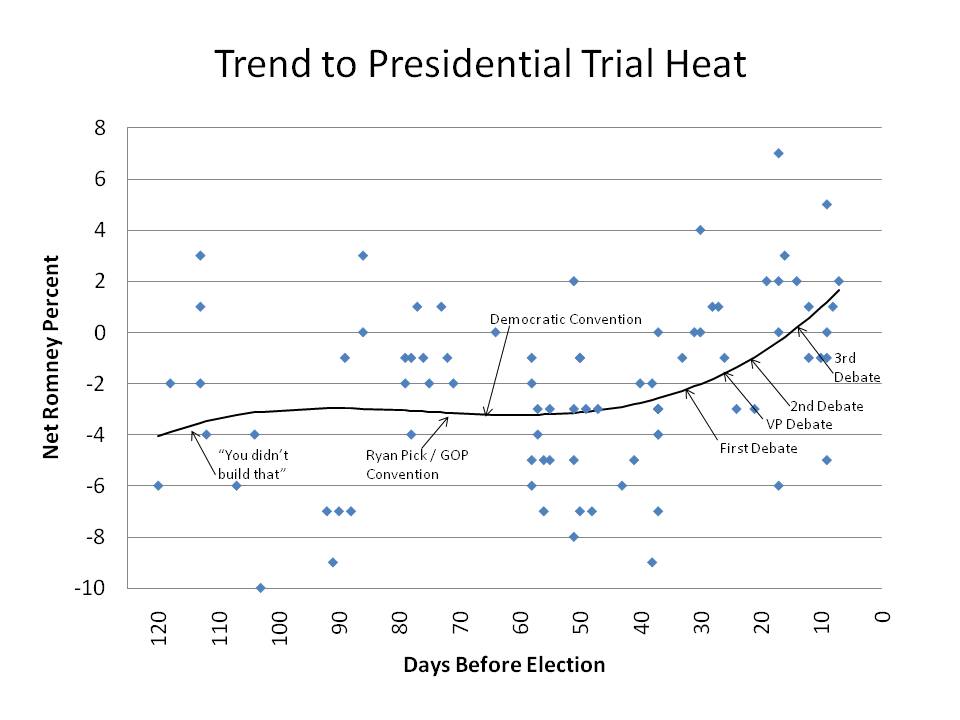
Put these three elements together -- Obama's current vote share, Romney's lead among Independent voters and overall GOP enthusiasm -- and it strongly suggests that Romney will win the popular vote. But if you want some more empirical data... here you go.
Using a regression equation, we were able to produce a model trend and project Romney's vote share out to election day. As of today, the model trend says that Romney is +1.9 percent. Tomorrow he would be +2.2 percent. Friday is +2.5 percent. The intercept is almost exactly +3.5; in other words, the below model suggests that Romney will win the popular vote by 3.5 points. Now let's assume this trend flattens a bit because of Super Storm Sandy. Our current estimate (which we will update next Tuesday morning) suggests that Romney will capture 51 percent of the popular vote to Obama's 48.5 percent. The trend line-based on 26 national polls conducted over the last 30 days --is both unmistakable and virtually unassailable.
Here is our up-to-the-minute take on the current environment:
- Hurricane Sandy helped the president politically, but it is unlikely to alter the election dynamic in any meaningful way. While the storm gave Obama a chance to look and act presidential, its greatest impact was in changing the storyline. What does it say about the president's trend that pundits latched onto this as the 2012 "October Surprise?" Team Romney did all the right things during this disaster and didn't hurt itself politically. And let's also remember that Sandy will have an economic toll, with cost estimates ranging between $30-50 billion. Additionally, Sandy could reduce fourth quarter GDP by half a point.
- Team Obama's race to define Romney as an "out of touch elitist" continues to pay off. The most troubling issue for Governor Romney is his perceived inability to understand the plight of average Americans. When Pew asked voters which candidate "connects well with ordinary people," Obama led Romney two-to-one (59 percent to 31 percent). This is hurting Romney everywhere, but it's especially damaging to his chances in Ohio, Iowa and New Hampshire. Again, that early Obama advertising in the spring and summer defined Romney and has continued to pay dividends for Team Obama.
- However, Romney's personal image has improved while Obama's has eroded. Romney's favorability rating is now approximately the same as Obama's (49-50 percent). Interestingly, the president's barrage of negative television spots -- while sometimes quite effective -- has taken a toll on his own favorability. The president's unfavorables have risen between five-six points in two months, and are now almost equal to his favorability rating. This represents a dramatic turnaround.
- Tomorrow's jobs report will be important. Obama needs some good news here and he may get it. While it is hard to determine what the report's impact will be (since it's being released so late in the game), it has the potential to provide momentum to either candidate.
- It appears that Romney is outspending Obama on the air by a two-to-one margin. According to Mark Murray at First Read, team Romney is spending $82.9 million in the final week of the campaign compared to Obama's $44.6 million.
All of the above is telling us one thing: this race is exceedingly close. We said a few weeks ago that this will come down to Ohio and we stand by that. The polling in Ohio shows the president up two to four points (and some have the president leading by even more than that). The question is whether Democrats are being oversampled; our gut instinct is that they are. If they are not, then Obama wins the state and wins the Electoral College quite handily. Both camps have a strong "ground game" in the state, but our inclination is to look at voter enthusiasm and Republicans have the edge there. Wisconsin, Iowa, Colorado and NH are also too close to call at this point. Nevada is leaning Obama and Virginia and Florida toward Romney.
On Tuesday morning we will release our final popular and electoral vote projections.
Thanks again to Pete Ventimiglia, Kelsey Cohen, Chris Blunt and Allison Quigley for their insights and contributions to the Election Monitor. Follow us on Twitter: @Steve_Lombardo.
Please note that the author was an advisor to the Romney for President campaign in 2008, but is not affiliated with any campaign in 2012.