On Thursday morning on Dec. 5th, the Minister of the Department of Basic Education, Angie Motshekga, was hailing an 'upward trend' in the results of the Annual National Assessment. Her praise only acknowledged grade improvements between 2012 and 2013. At no point was there any discussion of the undeniable downward trend we see across the board: that learner performance gets worse as they move through the system. Instead, grade nine was zeroed in on as a problem year or 'weak link.' That same day the Deputy Director General for Curriculum Development at the Department of Basic Education, Mweli Mathanzima, would completely sidestep the direct interview question on whether teaching in South Africa is improving.
Luckily for both of them but unluckily for South Africa, the passing of Nelson Mandela would happen that same day. Reportage swung away from anything that wasn't our grief but, now that the 21 gun salute has sounded, let's refocus on what Nelson Mandela himself identified as the most powerful weapon which you can use to change the world: Education.
The Annual National Assessment (ANA) results have been released. The yearly testing quantifies numeracy and language skills in grades one to six and grade nine and some fewer grades in private schools. This year, seven million children were tested. According to the results there have been modest increases and decreases in the performances, but considering that the department is aiming for an across-the-board 60 percent score in 2014 and 90 percent score by 2025, we're still very far off the mark.
Meanwhile, the interpretation and presentation of the data by the Department of Basic Education (DBE) has been problematic for a number of reasons. The worst score by grade has been in grade nine, leading commentary from the DBE to focus on grades seven, eight and nine as problem years with curricula in need of improvement or consolidation. The main issue with this misidentification of root cause is that it ignores a hefty report released just last month. Called the school monitoring survey, this report was commissioned and published by the DBE, and it was damning.
Now, just like Annual National Assessment results, the School Monitoring Survey also collects data at grades six and nine, for math and language. And like the ANA results, the survey found that learners in those grades were struggling. But the reason given by the report was not that the curricula were failing learners. Instead, a different factor explained the widening gap:
"If teachers do not teach a topic which is supposed to be covered during the school year (in whichever learning program/subject) then how will learners be able to perform on a test that is based on curriculum implementation expectations? More importantly, however, is the issue of progression: If the required number of topics in a learning program is not covered, learning of the topic will, in subsequent years, be even more challenging for the learner. The accumulated deficit will therefore widen as the learner progresses through the grades, because the basics were not covered sufficiently well or not covered at all."
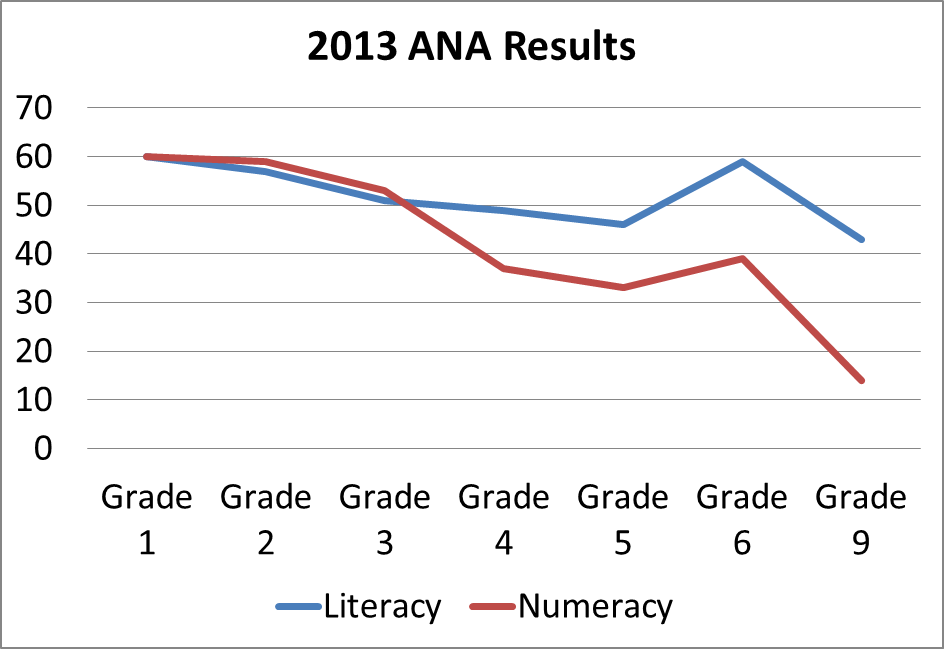
When learners enter the system in grade one, they are, on average, average. They are 60 percent on the nose. But by the time they're in grade nine, their language score has dropped over ten points and their math score has gone from 60 percent to the teens. Except for the occasional data point, learners continue on a downward trend and even rare spikes in their performance never rise over the initial 60 percent.
It is simply mind blowing that grade one is the best our students ever are. Grade one is the most uneven year. Some children have attended one or two years of pre-school, others have not. Some students have benefitted from rich learning environments at home, others have home environments not conducive to development. Socialization is an issue. Language is an issue. If anything, grade one should be a comparatively worse score, especially compared with later grades where students spend an extra two or more hours in lessons.
Instead we have an indicator that suggests learners get progressively worse the more time they spend in the education system. As the School Monitoring Survey found, the major cause for this is that our educational system is cumulative in practice. Doing well in grade two requires that you a) cover all of grade one's work and b) have practiced enough of the grade one material. This allows the learner to grapple with new concepts and applications in grade two.
If they fail to receive either the curriculum knowledge or the requisite practice (or both), they will have to do some of grade one's curriculum in grade two, leaving less time for learning and practicing grade two's work. Or the teacher can solider ahead without teaching them what they've missed, in which case they will score even worse in grade two. Either way, performance in grade two will suffer. This will impact on grade three, and grade three's poor performance will be compounded in grade four and so on as leaners become more and more incapable of learning.
The School Monitoring Survey found that in some schools there was very poor understanding among teachers of what was covered in the curricula for each year and subject, despite the work books being nationally standardized. In some cases, they found the students spent disproportionate amounts of time practicing easier material and one must wonder if the teacher's skill level influences this trend. The study also found that the average national absentee rate of teachers was 6.1 percent. This means that on an average day, 6.1 percent of educators were absent across the country. This rate was actually higher for primary school teachers than it was for high school teachers. Furthermore, the absenteeism rate actually excludes the numerous unfilled teaching positions that exist in our schools, which increase the burden on the teachers in the system. These are all very likely contributors to the lack of required advancement in learning and the accumulated knowledge deficit in our learners.
So just how bad, in numbers, is the progression problem? Well, the minimum required standard volume of work was set at four exercises a week in both grade six and grade nine, for both language and math. The report found:
"Of grade six learners nationally, only seven percent met this requirement for Language and 31 percent for Maths. Of grade nine learners nationally, only one percent met this requirement for language and six percent for maths."
The problem with the grade nine Annual National Assessment results isn't grade nine, it's teaching and progression in grades one to eight. Similarly, the gains and losses of the 2013 matric results are indicative of the entire 12 years spent in the education system.