The exit polls and election results demonstrate the powerful influence of the President on campaign 2014. Turnout was down from 2010. And forecasters and pollsters start looking back at what went wrong. This is HuffPollster for Thursday, November 6, 2014.
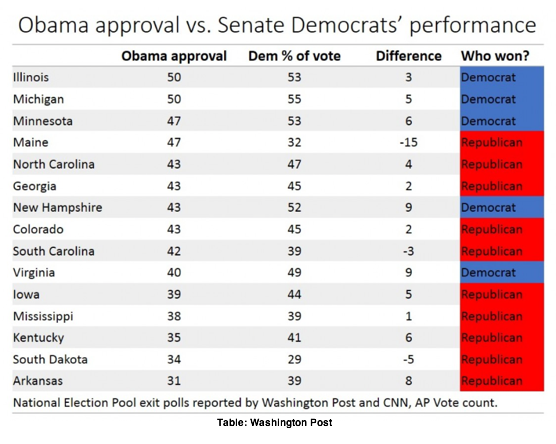
OBAMA'S UNPOPULARITY DRAGS DOWN DEMS - Scott Clement: "Why did so many Democrats lose on Tuesday? Here's the simplest answer: President Obama was a political dead weight for his party. No Democratic Senate candidate performed more than nine percentage points better than Obama’s approval rating in their state’s exit poll. This outlier over-performance was barely good enough for Sens. Mark Warner to pull off reelection in Virginia and Jeanne Shaheen in New Hampshire...Notably, both of these candidates are personally popular and serve in states that are evenly split between Democrats and Republicans. They also each spent time as governor before being elected to the Senate." [WashPost]
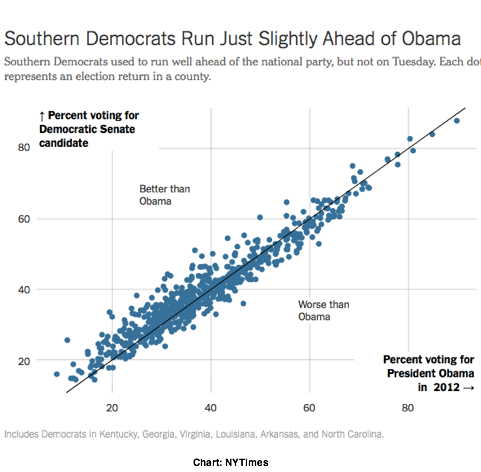
And none ran much ahead of Obama in the South - Nate Cohn: "The Democrats running in the South this election season were not weak candidates. They had distinguished surnames, the benefits of incumbency, the occasional conservative position and in some cases flawed opponents. They were often running in the states where Southern Democrats had the best records of outperforming the national party. Black turnout was not low, either, nearly reaching the same proportion of the electorate in North Carolina, Louisiana and Georgia as in 2012. Yet none of them — not Mary Landrieu, Alison Lundergan Grimes, Michelle Nunn, Kay Hagan, Mark Pryor or Mark Warner — was able to run Tuesday more than a few points ahead of President Obama’s historically poor performance among Southern white voters in 2012, based on county-level results and exit polls. There were some predominantly white counties in every state where the Senate candidates ran behind Mr. Obama, even in the former Democratic strongholds of Kentucky and Arkansas." [NYT]
A simple 'fundamentals' model that got it right - Sean Trende: "in the end, the fundamentals won out. Back in February of this year, I put together a simple, fundamentals-based analysis of the elections, based off of nothing more than presidential job approval and incumbency. That was it. It suggested that if Barack Obama’s job approval was 44 percent, Republicans should pick up nine Senate seats. Obama’s job approval was 44 percent in exit polls of the electorate, and it appears that Republicans are on pace to pick up nine Senate seats. Moreover, only one Democrat -- Natalie Tennant in West Virginia -- ran more than 10 points ahead of the president’s job approval." [RCP]
GENDER, AGE GAPS REMAIN WIDE - Pew Research: "Nationally, 52% of voters backed Republican candidates for Congress, while 47% voted for Democrats, according to exit polls by the National Election Pool, as reported byThe New York Times. The overall vote share is similar to the GOP’s margin in the 2010 elections, and many of the key demographic divides seen in that election — particularly wide gender and age gaps — remain. Men favored Republicans by a 16-point margin (57% voted for the GOP, 41% for Democrats) yesterday, while women voted for Democratic candidates by a four-point margin (51% to 47%). This gender gap is at least as large as in 2010: In that election men voted for Republicans by a 14-point margin while women were nearly evenly split, opting for GOP candidates by a one-point margin….as in 2010 — an older electorate compared with presidential elections advantaged the GOP. Fully 22% of 2014 voters were 65 and older — a group GOP candidates won by 16-points. By comparison, in 2012, they made up just 16% of the electorate." [Pew]
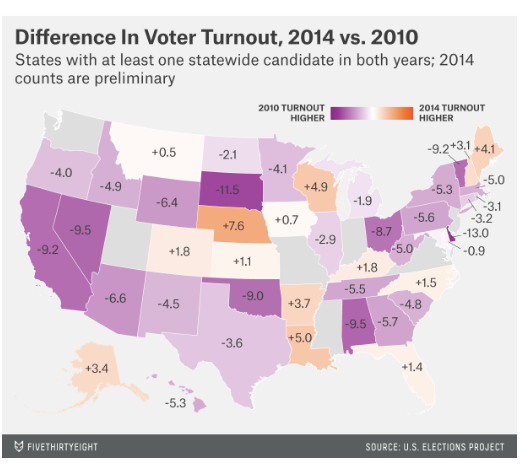
TURNOUT WAS DOWN FROM 2010 - Carl Bialik and Reuben Fischer-Baum: "[E]nough data is in for Michael P. McDonald, a political scientist at the University of Florida, to make preliminary estimates of turnout. And what they show is a steep decline from recent national elections. McDonald estimates that just 36.6 percent of Americans eligible to vote did so for the highest office on their ballot. That’s down from 40.9 percent in the previous midterm elections, in 2010, and a steep falloff from 58 percent in 2012. Numbers for 2014 should be treated with care, McDonald cautioned on his website. For one thing, they don’t come from his preferred measure, which is total ballots counted divided by total voting-eligible population; that isn’t available yet. Also, he’s made projections to fill in gaps in the data. 'These may not accurately reflect the actual number of outstanding ballots cast on Election Day, outstanding mail ballots yet to be counted, and provisional ballots to be counted,' he wrote." [538]
Lowest rate since 1940? -- Michael McDonald: "National turnout with fresh eyes this morning still looks low. If doesn't beat 1998's 38%, would be lowest since 34% in 1940...No state had a turnout rate below 30% in 2010. This year there are several with uncompetitive elections threatening not to make the cut." [@ElectProject here and here]
Amplified Democrats' U.S. House losses - David Wasserman: "Plain and simple, the story in House races was an epic turnout collapse and motivational deficit. Democrats' surprisingly large losses are attributable to 'orphan states' where there was little enthusiasm for top-of-the-ticket Democrats. For example, in New York, the lack of a competitive statewide race caused Democratic turnout to plummet, and Reps. Tim Bishop (NY-01) and Dan Maffei (NY-24) suffered surprisingly wide defeats." Wasserman adds more via Twitter: "Flawed assumption many (including me) made was 2010 #s were Dems' absolute low-watermark in many states/districts. Turns out, they weren't." [Cook Political, @Redistrict]
A THEORY FOR THE POLLING MISFIRE - Joshua Tucker: "Is it possible that pollsters overestimate the previous election when constructing their weights for the current election? So yes, there are good reasons to think it is harder to reach young people today using telephone surveys. But of course pollsters know this, and so adjust the weights of their surveys accordingly. But with fewer young people in their surveys — combined with the possibility that the young people you can reach by phone are not representative of young people generally — the work that has to be done by these weights grows. Now, not wanting to get a mistaken estimate because of this bias, I wonder if the polling overcompensated in terms of weights in this regard because of the voting patterns observed in the 2012 presidential elections. To be clear, I am not stating that I think pollsters applied presidential turnout models to an off-term election, but instead whether the subtle concerns about underestimating portions of the 2012 electorate led pollsters to overcompensate in setting their weights for the 2014 elections, which in turn had a larger effect due to declining response rates to surveys." [WashPost]
BRIER SCORING THE FORECASTERS - John Sides: "[C]ounting winners isn’t the best way to evaluate forecasting models. A better (though not perfect) tool is Brier scores. Most forecasters favor making these one part of the evaluation process, as Carl Bialik of 538 notes. Brier scores take into account both whether races were called correctly and the underlying confidence of the forecast. The best outcome is to be 100 percent certain and correct (a Brier score of 0). The worst outcome is to be 100 percent certain and incorrect (a Brier score of 1). Lower scores are better. Here are some preliminary estimates, excluding Louisiana but assuming Warner and Sullivan victories:
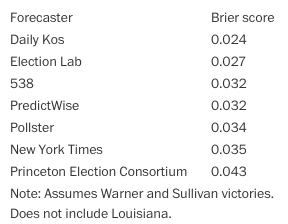
"Because the forecasts were calling most of the same winners, the differences here are mainly due to confidence. The forecast with the lowest score was the Daily Kos, which was run by political scientist Drew Linzer. The Election Lab forecast had the second lowest score. One other way to compare these scores is this: the difference of a score of 2.5 and a score of 5 is about the difference between what our forecasting model has previously scored on Election Day vs. two weeks to go." [WashPost]
What forecasts got right -- and wrong - Josh Katz: "In the aggregate, pollsters were off — way off. Arkansas was expected to be a Republican win, but not an 18-point blowout for Tom Cotton. Virginia was expected to be a safe Democratic victory, not a nail-biter that, as of Wednesday afternoon, remained too close to call. In races around the country, polls skewed toward the Democrats, and Republicans outperformed their polling averages by substantial margins….Perhaps just as notable as where polling averages missed is where they did not. In Alaska, often trotted out as the prototype of a state that’s difficult to poll, the polling average fell within a single point of the current vote margin. Meanwhile, in Virginia, henceforth to be known as the Alaska of the East, polls underestimated support for the Republican, Ed Gillespie, by about 9 points. Errors in Arkansas and Kentucky were similar…. In general, putting too much weight on these post hoc evaluations could leave you vulnerable to outcome bias. Suppose we decide to flip a coin — you say the probability that it lands heads is 50 percent; I say it’s 100 percent. I flip the coin and it lands heads. Whether you use Brier scores or logarithmic scores, my forecast will be judged better than yours. In fact, my forecast will be judged better by almost any reasonable metric. It’s only in the long run, over many repeated flips, that the flaws in my forecast would be revealed….But we can’t repeat the 2014 election multiple times….It’s only in judging outcomes over a series of elections that these methods are useful." [NYT]
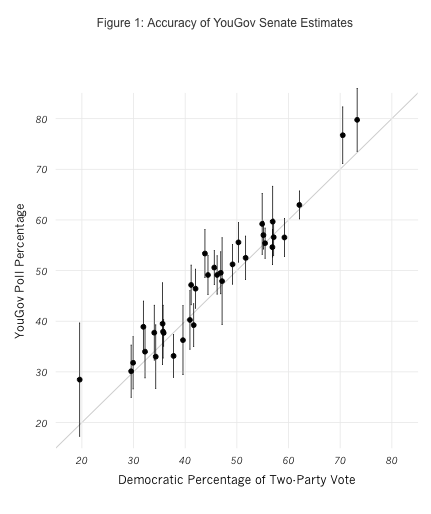
YOUGOV REVIEWS ITS NATIONAL POLLING - Doug Rivers on the Senate polls: "In terms of getting the outcome right, we did fairly well (only missing in Iowa and North Carolina, where we gave Democrats leads of 1.0% and 2.1%, respectively). However...it is evident that we had a consistent overstatement of the Democratic vote. On average, our polls over-estimated the Democratic share of the two party vote by 2.0%. This was not unusual – most polls this year overstated Democratic performance – but this is a larger average bias than we have encountered in previous years….The average absolute error ranged from 2.6% (for CNN/ORC) to 3.7% (for NBC/Marist), with YouGov in the middle of the pack. Every pollster exhibited a Democratic bias of around two percent, though YouGov's was slightly smaller than the others. Our percentage of correct leaders was higher, but this is not really a fair comparison (since we polled a large number of uncompetitive races).... In post-election surveys, we plan on recontacting all voters to determine whether these respondents actually voted and, if so, for whom." [YouGov]
And the House polls - "In 97% of the races, the leader in the poll was also the election winner. The leading candidate only lost in 13 of 435 seats. 11 of the 13 miscalled races were won by a Republican and two by a Democrat. In 339 of the 354 contested races (96%,) the poll estimate was within the margin of error….The average error (or 'bias') was 1.74%, indicating that, on average, we over-estimated Democratic vote by a bit less than two points. We have a similar Democratic bias in our Senate estimates and most other polls suffered from similar problems. In past elections, we have been able to obtain an average error less than 1% in magnitude, so this represents an area for further investigation and potential improvement. Finally, aggregating our estimates across districts, we predicted that Republicans would end up with 239 seats. The actual outcome appears to be that Republicans will win 244 seats." [YouGov]
HUFFPOLLSTER OFF ON FRIDAY - After a busy election season, HuffPollster will be taking a long weekend. See you again on Monday.
HUFFPOLLSTER VIA EMAIL! - You can receive this daily update every weekday morning via email! Just click here, enter your email address, and and click "sign up." That's all there is to it (and you can unsubscribe anytime).
THURSDAY'S 'OUTLIERS' - Links to the best of news at the intersection of polling, politics and political data:
-Stu Rothenberg says he saw the midterm election wave coming. [Roll Call]
-Steven Shepard reports on a bad night for the polls. [Politico]
-Bill McInturff (R) mines the exit polls to explain why "elephants are dancing." [POS]
-Alex Rogers reviews why pollsters got so many races wrong. [Time]
-Larry Sabato wants an "investigation" into Virginia's polling. [TPM]
-Several pollsters say polls did well on Election Day 2014. [538]
-Voters' guesses as to who would win the midterms were more accurate predictors than who they said they would vote for. [NYT]
-"You can't win on turn-out if you are losing on message," a smart Republican pollster tells Amy Walter. [Cook Political; was it this guy?]
-Harrison Hickman (D) offers the top 10 least helpful Democratic excuses. [HuffPost]
-Democratic pollsters attribute their loss to the lack of an economic message. [WashPost]
