

Flat Lines
I admit that "flat lines" sounds pretty bad, so allow me to clarify. In a hospital, when the beepy machine flatlines, you are dead. But in the world of polling, flat lines mean a zero slope -- neither changing for the worse or for the better. A more accurate way to say it might be "stuck in neutral" or "spinning your wheels," I guess. But the lines on the chart are what they are, and so we're stuck with a bad metaphor to open with this month, for which I apologize.
When taken as a whole, President Barack Obama's poll numbers last month moved the least amount of any month of his presidency so far. His approval rating continued its trend of moving downwards, but only by two-tenths of a percent. His disapproval rating continued upwards, but only by four-tenths of one percent. Meaning January was a pretty stable month for Obama.
February, by contrast, seems to be shaping up in a much more interesting fashion, but that will have to wait until next month, when the numbers come in. For now, though, we'll have to content ourselves with a look back at January in this month's Obama Poll Watch column.
After taking a look at Obama's numbers for the month, we continue our march backwards through history, this month serving up a comparison between Obama and Richard Nixon's term-and-a-half.
As always, at the ObamaPollWatch.com website, there are charts with up-to-date comparisons between Obama and all past presidents from Nixon forward. We're in the midst of a site redesign, so if you haven't seen it for a while, we urge you to check it out.
But enough shameless shilling of websites. Let's get right to the numbers and charts for January, to see where Obama now stands with the public.
[Click on graph to see larger-scale version.]
January 2010
January was a fairly calm month for Obama, as the White House prepared all month long for the State Of The Union speech by running ideas up the flagpole to see who saluted. Health insurance reform negotiations between the House and Senate stalled, even though reportedly Obama himself devoted a lot of personal time and attention to the issue. But nothing came as a result of the high-stakes negotiation, unless you count losing Ted Kennedy's Senate seat to the Republicans in a special election in Massachusetts. This was a body blow to Democrats, and the first casualty was the health insurance reform debate, which immediately degenerated into (as Obama would put it later) Democrats "running for the hills."
Obama, to his credit, not only got the Massachusetts wake-up call, he actually woke up. And decided it was time for some changes. The first of which was a seeming embrace of populism, and a much tougher stance towards Wall Street banks. The second was a minor shakeup in advisers, with Paul Volcker coming in from the cold, as well as the return of David Plouffe. The third was the actual issuance of a few veto threats during his State Of The Union address. And the final change was that Obama appears to have completely discounted the advice "don't get too overexposed," and is now taking his message out to the electorate in a seriously aggressive way.
In other words, Obama had a pretty good end to the month, after the Massachusetts election shocked all Democrats in Washington. Other Democrats haven't been so quick to react, or even respond, but this column isn't really about them, so I'll save that criticism for another day.
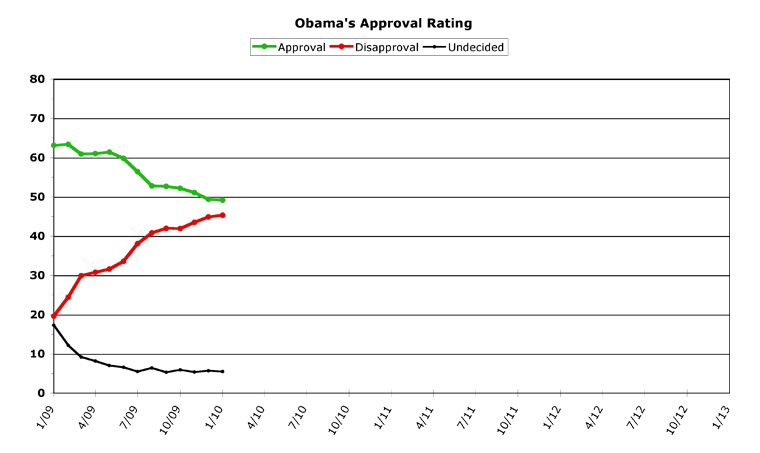
In terms of poll numbers, Obama may finally have hit bottom in January. It's still too early to tell, but mid-month seemed to mark a turning point for the president. Whether this is a true bottom, or just a momentary plateau will be a lot clearer next month. In January, Obama's monthly average approval rate hit a new low once again, at 49.2 percent, but this was only down 0.2 points from the previous month (when it fell 1.7 percent, for comparison). And Obama's disapproval rate was at another all-time high at 45.3 percent, but again, this was only up 0.4 points from the previous month (when it rose by 1.4 percent).
Overall Trends
The overall trend this month is that there weren't really any trends, leading to almost-flat lines on the graph for both approval and disapproval. While the loss of a Senate seat in Massachusetts was indeed an earthshaking event in the American political world (and will continue to have repercussions all year long), it wasn't really something that people connected to Obama all that much. And, after indicating that his big speech to Congress was going to slip until February, Obama decided (post-Massachusetts), to move it up a week, putting it back in January. Obama's speech gained him a mini-bump in the polls, but because it was so close to the end of the month, a few more weeks are required to see if this bump is anything more than a momentary blip. As I said before, next month is going to be much more interesting, as we see whether Obama's new political strategy pays off for him with the public or not.
In January, Obama's daily numbers bounced around a bit, even if the monthly number was pretty stable. His approval numbers hit an early high in the first week of the month, at 50.3 percent, then fell back sharply the following week to hit the month's low at 47.6 percent (also a new all-time low for Obama). For the rest of the month, Obama gained back some ground, lost it again, and then gained it back -- but would not see his numbers rise above 50.0 percent for the rest of the month. Obama's disapproval numbers moved around a bit as well, and hit an all-time high towards the end of the month, at 47.0 percent.
Gratuitous second plug of the website -- ObamaPollWatch.com now has convenient mini-charts from both RealClearPolitics.com and Pollster.com which show daily graphs, for those of you who want the day-to-day outlook in graphical form.
While Obama has been making lots of news in the past week or so with his new communications blitz, it remains to be seen whether any of what is admittedly brilliant politics will rub off on Congress, to the extent that they actually do something. In other (blunt) words, almost everyone (even his detractors) know by now that Obama talks a good line, but the "benefit of the doubt" train left the station a while back for many, and at this point a lot of folks are waiting to see if anything actually gets accomplished as a result -- a much higher bar to hit.
But February will be the test case for "the new Obama" in a lot of ways. And, since flat lines really note the absence of a trend rather than an actual trend, we'll just have to leave it there for this month, and wait and see what next month has to offer.
Obama v. Richard Nixon
As we get further and further removed from the present in our comparisons with past presidents' approval ratings, it gets harder and harder to truly draw any parallels, since times were a lot different in American politics so many decades ago.
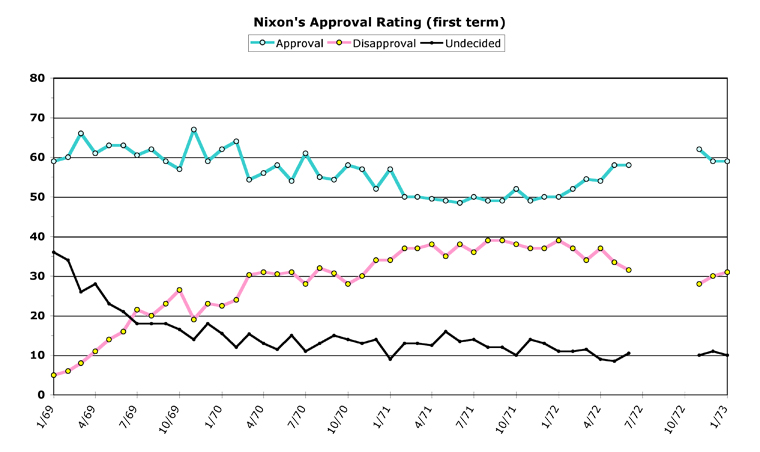
But, very briefly, let's take a look at Obama versus Tricky Dick Nixon. Nixon, for all he's reviled today, actually had a pretty decent first term in the opinion polls.
[Click on graphs to see larger-scale versions.]
Nixon spent his first year mostly above 60 percent approval, his second year solidly in the 50-60 percent range, and only in his third year in office did he occupy the territory Obama finds himself in now -- scraping just below the magic 50 percent threshold. He then pulled out of this slump in his last year, during the re-election campaign, to finish up exactly where he began his first term, just shy of 60 percent. [Apologies for the discontinuity in the graph in 1973, there was a gap in the available Gallup numbers I use to create these graphs.]
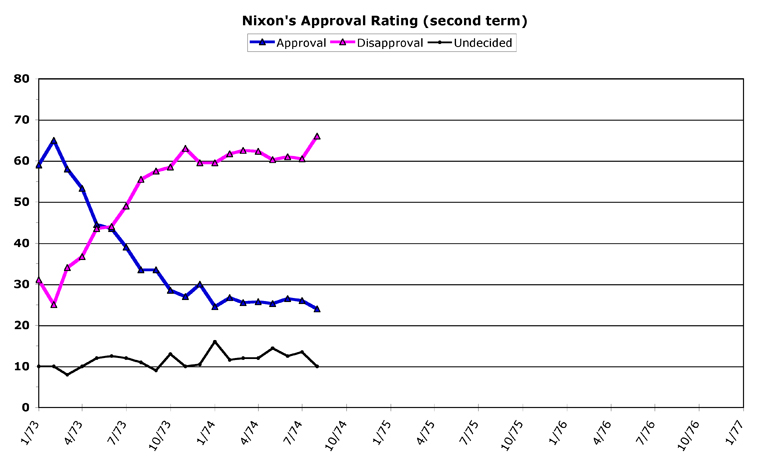
Nixon's second term, what there was of it, tells a radically different story.
[Click on graphs to see larger-scale versions.]
Nixon peaked early, one month after his second term began, hitting 65 percent approval. But then the Watergate scandal destroyed his standing in the polls, as more and more information leaked out. Nixon hit a devastatingly low 24 percent approval, right before he resigned office -- poll territory no other president would see in his approval numbers, until the end of George W. Bush's second term, of course.
[Click on graphs to see larger-scale versions.]
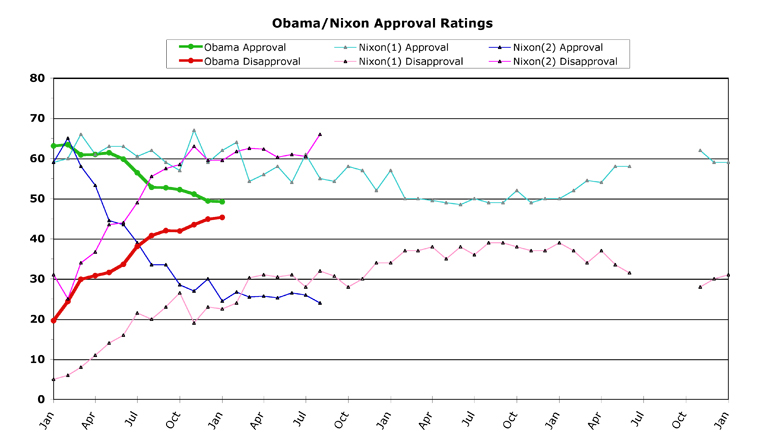
Nixon's first term versus Obama shows pretty much the same approval trendline, but stretched out over three years for Nixon as opposed to a single year for Obama. Obama's disapproval numbers are much higher, though, than Nixon's entire first term. Nixon's disapproval numbers didn't hit the highs that Obama's hit until around one year before he actually resigned. Part of this is Nixon's fairly high rate of "undecided," but most of it is due to Nixon's overall good numbers on the approval line.
Next month, we'll take a brief look at how L.B.J. stacked up to Obama (so far) in the opinion polls. Until then, faithful poll-watchers, I bid you adieu....
[Obama Poll Watch Data:]
Column Archives
Obama's All-Time Statistics
Monthly
Highest Monthly Approval -- 2/09 -- 63.4%
Lowest Monthly Approval -- 1/10 -- 49.2%
Highest Monthly Disapproval -- 1/10 -- 45.3%
Lowest Monthly Disapproval -- 1/09 -- 19.6%
Daily
Highest Daily Approval -- 2/15/09 -- 65.5%
Lowest Daily Approval -- 1/13/10 -- 47.6%
Highest Daily Disapproval -- 1/28/10 -- 47.0%
Lowest Daily Disapproval -- 1/29/09 -- 19.3%
Obama's Raw Monthly Data
[All-time high in bold, all-time low underlined.]
Month -- (Approval / Disapproval / Undecided)
1/10 -- 49.2 / 45.3 / 5.5
12/09 -- 49.4 / 44.9 / 5.7
11/09 -- 51.1 / 43.5 / 5.4
10/09 -- 52.2 / 41.9 / 5.9
09/09 -- 52.7 / 42.0 / 5.3
08/09 -- 52.8 / 40.8 / 6.4
07/09 -- 56.4 / 38.1 / 5.5
06/09 -- 59.8 / 33.6 / 6.6
05/09 -- 61.4 / 31.6 / 7.0
04/09 -- 61.0 / 30.8 / 8.2
03/09 -- 60.9 / 29.9 / 9.2
02/09 -- 63.4 / 24.4 / 12.2
01/09 -- 63.1 / 19.6 / 17.3
ObamaPollWatch site:
Chris Weigant blogs at:
Follow Chris on Twitter: @ChrisWeigant