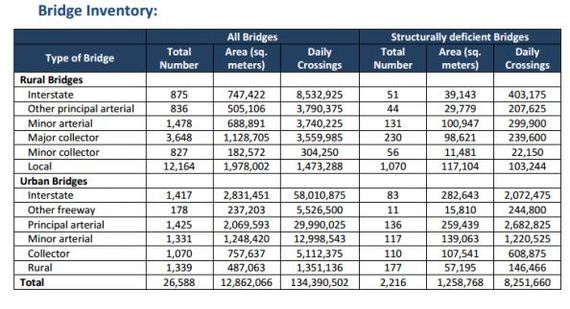
Illinoisans cross the 13 million square miles of Illinois' 26,588 bridges more than 134 million times every day.
Of those 26,588 state and federal bridges, 2,216 are structurally deficient, meaning one or more key bridge components (i.e., deck, superstructure or substructure) are considered to be in poor or worse condition, according to the American Road and Transportation Builders Association's (ARTBA) review of 2014 data from the Federal Highway Administration (FHWA). An additional 1,971 are classified as functionally obsolete, which means a bridge's design is no longer sufficient for its current use.
The FHWA uses a 10-point scale to determine the structural and functional condition of a bridge. If any one of a bridge's three main components rates 4 or lower, repair is needed. In Illinois, the estimated cost of repairing a total of 2,872 bridges is roughly $9.4 billion, according to ARTBA.
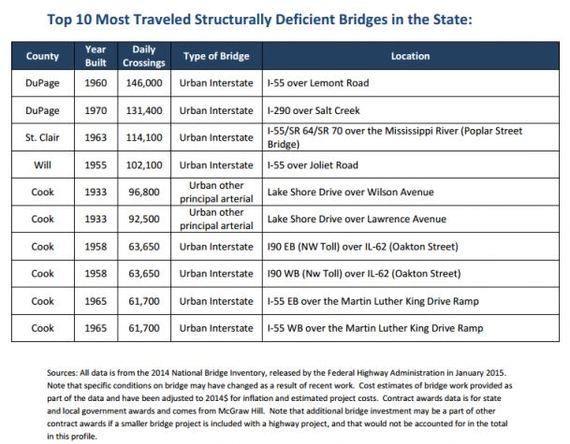
Here's a look at the state's bridge inventory and the number of structurally deficient rural and urban bridges, as well as the top 10 most traveled structurally deficient bridges in Illinois.
Using the most recent data from FHWA, these counties have the highest percentage of deficient bridges in Illinois. For a fairer comparison, we've divided the total number of deficient bridges by the total number of bridges in each county, since more populated counties typically have a larger number of bridges.
25. Madison
- Count: 520
- Deficient: 40
- Obsolete: 51
- Total deficient: 91
- Total deficient area: 128,550 sq mi
- Percent of deficient bridges: 17.50%
24. White
- Count: 216
- Deficient: 33
- Obsolete: 5
- Total deficient: 38
- Total deficient area: 15,336 sq mi
- Percent of deficient bridges: 17.59%
23. Massac
- Count: 130
- Deficient: 7
- Obsolete: 16
- Total deficient: 23
- Total deficient area: 15,530 sq mi
- Percent of deficient bridges: 17.69%
22. Wabash
- Count: 90
- Deficient: 13
- Obsolete: 3
- Total deficient: 16
- Total deficient area: 3,544 sq mi
- Percent of deficient bridges: 17.78%
21. Clinton
- Count: 189
- Deficient: 15
- Obsolete: 19
- Total deficient: 34
- Total deficient area: 10,270 sq mi
- Percent of deficient bridges: 17.99%
20. Macon
- Count: 345
- Deficient: 49
- Obsolete: 14
- Total deficient: 63
- Total deficient area: 39,589 sq mi
- Percent of deficient bridges: 18.26%
19. Fayette
- Count: 361
- Deficient: 35
- Obsolete: 32
- Total deficient: 67
- Total deficient area: 26,934 sq mi
- Percent of deficient bridges: 18.56%
18. Effingham
- Count: 250
- Deficient: 15
- Obsolete: 32
- Total deficient: 47
- Total deficient area: 22,713 sq mi
- Percent of deficient bridges: 18.80%
17. Clay
- Count: 164
- Deficient: 20
- Obsolete: 11
- Total deficient: 31
- Total deficient area: 5,227 sq mi
- Percent of deficient bridges: 18.90%
16. Lawrence
- Count: 177
- Deficient: 29
- Obsolete: 5
- Total deficient: 34
- Total deficient area: 15,863 sq mi
- Percent of deficient bridges: 19.21%
Check out the rest of the 15 Illinois counties with the highest percentage of structurally deficient bridges at Reboot Illinois.
Sign up for our daily email to stay up to date with Illinois politics.
- Betcha didn't know these 30 fun Illinois facts!
- Weird place names in Illinois
- House approves bill to decriminalize marijuana in Illinois
- The top 20 most challenging high schools in Illinois
- Want to tell your elected officials what you think of the state of government in Illinois? Use our Sound Off tool.