Over the last month, I've been hearing countless financial professionals boasting of 17-20 percent returns over the last three years. And like anyone, I was amazed. Until I did the math.
NASDAQ has doubled since 2009, putting the annualized return at 25 percent over the past four years -- meaning anything below that is performing below the general market! Also, the three-year performance metrix is conveniently shaved to exclude the Great Recession. Most people bragging about 20 percent gains are covering up the fact that their clients lost way too much during the Great Recession and are still underwater -- even with a robust bull market.
So, rather than being wowed by what is basically a market recovery, sober up and examine the data that really matters. Today's bull has been (and will continue to be) a bucking bronco that has left most riders bruised, broken, weary and rattled.
5 Ways to Separate Superior Performance from Salesmanship.
1.Ask for the five- and 10-year Performance
2.Discern between Cumulative and Annualized Gains
3.Do a Stock Report Card
4.Examine the Credit Risk
5.Read the Fine Print
And here is more information.
1.Ask for the five- and 10-year Performance.
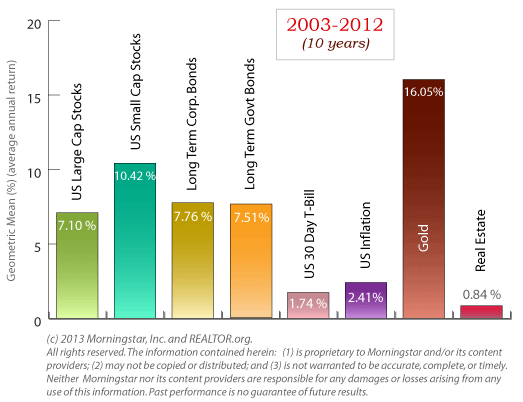
Below is a 10-year performance chart of large caps, small caps, bonds, gold, real estate and Treasury bills. As you can see, diversification is key. So, is a sober understanding of average ROI of each asset.

Twenty percent annualized gains over three years is a losing proposition if the performance during The Great Recession was -- 50 percent, as you can see clearly in the illustration below. If you lose 50 percent of your nest egg and then earn back 20 percent annually, you'll still be down almost 15 percent because it takes twice as long to crawl back to even when you lose that much money.
$1,000,000 goes to $500,000 (when you lose 50 percent)
$500,000 becomes $600,000 (with 20 percent gain)
$600,000 becomes $720,000 (with 20 percent gain)
$720,000 becomes $864,000 (with 20 percent gain)
You are still down $136,000 in this scenario
Conversely, if you diversify, keep the proper amount safe, know what safe is and rebalance your nest egg annually, then you'll be enjoying well above the average 10-year gains, without risking the devastating losses.
2.Discern between Cumulative and Annualized Gains
Some salesmen will show you cumulative gains for added wow factor. One-hundred percent cumulative gains over a 20-year period is only 5 percent annualized, a very low rate of return on investment. Whenever you see the word "cumulative" you have to divide the return by the number of years to get the annualized return. And you should also double-check to be sure that the last recession hasn't been conveniently excluded.
3.Do a Stock Report Card
Dividend-rich stocks are all the rage today. Most people don't realize that a large number of dividend-paying companies are the ones carrying the most debt. Many bankrupt companies were paying very high dividends the year that they declared bankruptcy. That is why it is important to do a Stock Report Card on companies that you own, and to understand why New Chips are safer than Blue Chips. I outline this in greater detail in The ABCs of Money.
4.Examine the Credit Risk
You can see how much debt the company is carrying by checking out the Debt to Equity Ratio on your favorite financial website, or by doing a Stock Report Card. Oftentimes, in the companies with the most debt, you'll have to consult the SEC filings to find out how much they owe because the D/E field will say "NA" (Not Available). Debt tends to be concentrated in companies that were founded before 1980 and have, or once had, pension plans and defined benefits (rather than employee-directed 401ks). This is a big reason why so many auto manufacturers and airlines have gone bankrupt. There are many other legacy corporations with the same challenges -- legacy costs, high debt and thin profit margins -- that are paying a good dividend to keep investors engaged.
5.Read the Fine Print
Surrender fees, annual fees, maintenance fees, going below a certain balance, taxes... The fine print on many financial products is so complicated and convoluted these days that even the salesmen have difficulty understanding the terms. Last November, Mass Mutual settled with the SEC over insufficient disclosures on an annuity product. AIG annuity customers would have been bankrupted if the company had not been bailed out. Seniors hoping for a guaranteed return are also susceptible to scam artists who are willing to offer that promise without any intention of keeping it. (Madoff is not the only crook of this nature.) Read the fine print and check into the history and the fiscal health of any company that you are planning to do business with.
Buy and hold hasn't worked in this millennium and will not work going forward because we are in a slow growth economy. (The new Congressional Budget Office projection for 2013 GDP growth is 1.4 percent) Modern Portfolio Theory, combined with avoiding the bailouts, adding in hot industries, getting safe, knowing what safe is and annual rebalancing has been performing well above that magic 10 percent annualized gain you need to retire rich and happy (without all of the worry and stress that Buy and Hold investors are suffering from). This might sound difficult, but it is actually easy as a pie chart, and is something that you can learn firsthand in my Investor Educational Retreats.
