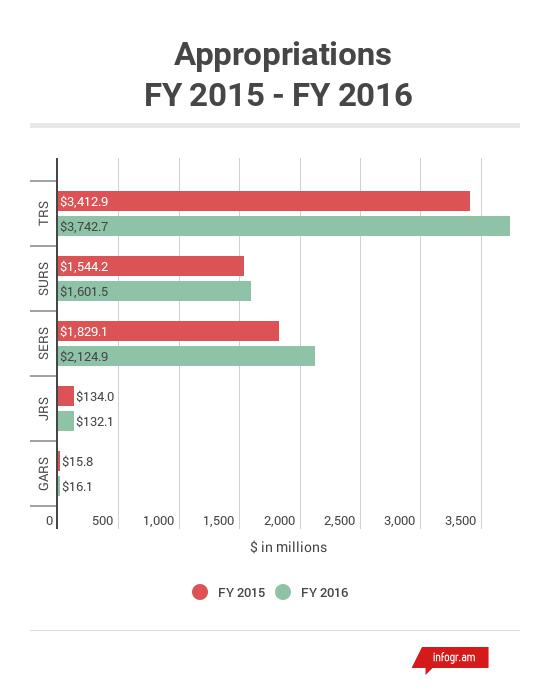
Since 1996, Illinois has appropriated $67.3 billion to the state's five retirement systems, according to the General Assembly's Commission on Government Forecasting and Accountability.
The Teachers' Retirement System has received nearly 52 percent, or $34.9 billion, of state pension payments over the past 20 years, while the much smaller Judges' and General Assembly Retirement Systems have been appropriated the least.
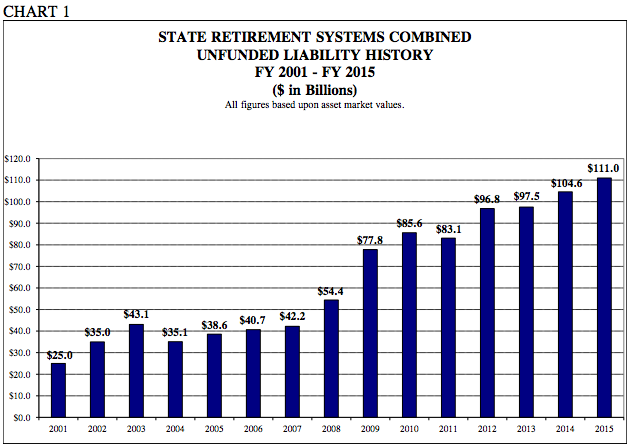
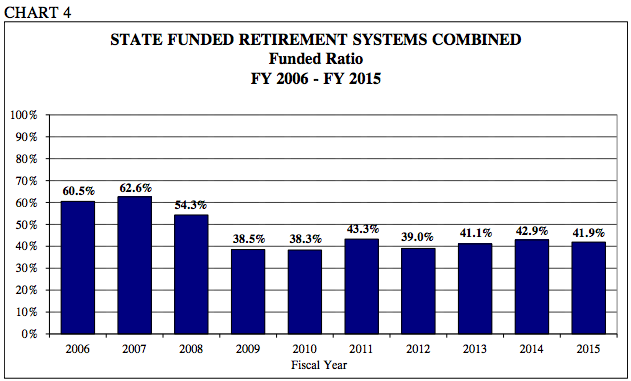
Based on the actuarial value of assets, which includes asset smoothing effects, the combined funded ratio of all five systems was 40.9 percent with $112.89 billion in unfunded pension liabilities as of June 30, 2015. But as the commission's report notes, the market value of assets paints a much more realistic picture of the systems' financial positions as it reflects the volatility of the market (you can read more about the differences here). Based on the market value of assets, which does not include asset smoothing effects, unfunded liabilities totaled $111 billion and the funded ratio 41.9 percent.
From the report:
Chart 1 is based upon calculations using the market value of assets for all years, including FY 2015. The full effects of the large investment losses during FY 2009 and investment gains for FY 2011 are therefore reflected in the bars for these years. These extremely large investment losses are the main reason for the significant jump in unfunded liabilities during FY 2009. The asset smoothing approach, required by Public Act 96-0043, only recognized 20 percent of the FY 2009 investment losses during that fiscal year. Chart 1 above recognizes 100% of the FY 2009 investment losses in FY 2009, and is therefore a much more realistic representation of the retirement systems' true financial condition. In FY 2013, the market value of investment returns were above the actuarially-assumed rate for all systems. This helped control the growth of unfunded liabilities to a certain degree, however they still rose primarily due to insufficient contributions made by the State.
Here's a quick look at the five Illinois pension systems as of June 30, 2015.