By Irene Aldridge and Steven Krawciw
Recent market moves left many buy-side investors puzzled and wanting for more information. Was the extreme volatility observed in the Fall of 2014 a gust of wind or a hurricane, a harbinger of further price swings to come? Our research, AbleMarkets.com, provides answers.
Take an absolutely ordinary day, Monday, October 13, 2014. It was Columbus Day, a banking holiday, when stock markets are open, nevertheless. Typically, Columbus Day is a quiet trading day, with little news to move the securities prices. This day was no different: the only event listed on Bloomberg LP was a speech by Chicago Federal Reserve Bank President Charles Evans. Dr. Evans happened to address the National Council on Teacher Retirement in Indianapolis at 12:30 PM ET that day.
Dr. Evans' speech was nothing new or extraordinary. According to WSJ,
"Evans essentially repeated a speech given October 8. Prior highlights: Chicago Fed's Evans remained in the dove camp. He stated that he wants to see more certainty in data of movement toward the Fed's dual mandate. He is uncomfortable with calls for policy rate increases sooner than later. A key concern is slower global growth. "
As Dr. Evans spoke, however, U.S. equity markets took an unusual plunge, with the S&P 500 dropping nearly 2% from 12:30 PM until the 4:00 PM ET, shown in Figure 1 for the S&P 500 ETF (NYSE:SPY). What happened to cause such a drop on an ordinary Columbus Day?
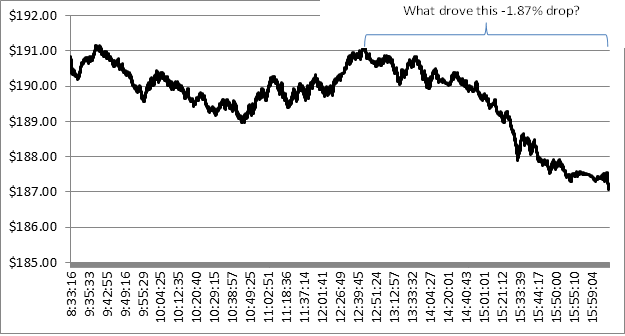
Figure 1. Price of the S&P 500 ETF (NYSE: SPY) on Monday, October 13, 2014.
At AbleMarkets.com, we are capable of examining intraday market activity on many different levels, and are able to say with reasonable confidence whether the sudden price change was caused, or at least, coincided with any of the following occurrences:
•High institutional trading activity
•High aggressive HFT activity
•Flash-crash prone market conditions
•Abnormal trading activity, such as runaway algorithms and the like
•Other metrics
These trading activity measures are rooted in our proprietary market microstructure research, over 8 years in development, and produce spot-on results. Some of the intuition behind the models, such as the Flash Crash identification, was published in academic journals (see, for example, Aldridge, I., "High-Frequency Runs and Flash Crash Predictability" in the Journal of Portfolio Management, Spring 2014).
On October 13, 2014, institutional selling activity did pick up, but only after 3 PM ET, well after the sell-off was underway, as Figure 2 shows for the S&P500 ETF (NYSE:SPY). While the institutional selling undoubtedly added fuel to the fire, driving down prices, it did not initiate the selling activity that exacerbated around 1:30 PM, as shown in Figure 1. Likewise, an increase in the aggressive HFT selling activity also happened well after 3 PM ET.
AbleMarkets Abnormal Trading Activity Index and Flash Crash Index tell a story about what actually happened on October 13, 2014, however. The AbleMarkets Abnormal Trading Activity index spiked dramatically around 14:25 ET, the occurrence that was followed by a dramatic, ever steepening sell-off. While further investigation is needed as to which type of the abnormal trading activity actually caused a plunge, the abnormal trading activity happened against a back-drop of "jittery markets," as measured by AbleMarkets Flash Crash Index (Figure 5). The Flash Crash Index, calculated a day ahead, detects market microstructure conditions that make a specific market or any financial instrument prone to flash crashes on the following trading day. Combined, a market susceptible to flash crashes and an incident of abnormal trading activity appear to have caused a dramatic sell-off on an otherwise ordinary day.
As Figure 6 illustrates, the spike of abnormal trading activity, when superimposed on the price of the S&P 500 ETF, exactly corresponds to the time when the sell-off started. In the future, real-time market surveillance, such as AbleMarkets tools, can take the guesswork out of intraday market activity, pinpointing to regulators, traders and investors what has happened in a real-time framework. In our current environment of extreme volatility, such knowledge is not only desirable but is increasingly valuable to market participants seeking to increase returns, save costs, and stabilize market performance.

Figure 2. Institutional buying (InstPctBuys) and selling activity (InstPctSells) in NYSE:SPY, as a percent of volume traded within each ½ hour time period during October 13, 2014 (the chart includes pre-market and after-market values)
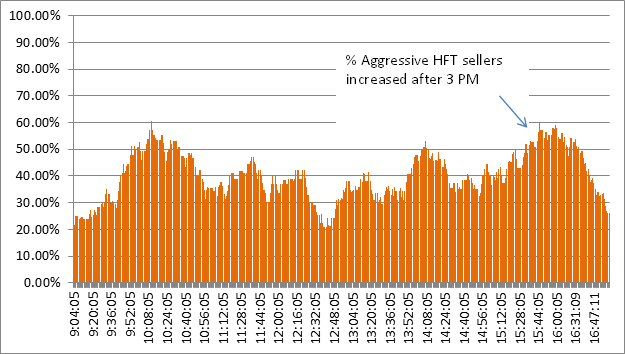
Figure 3. Participation of Aggressive HFT by Volume Among Market Sell Orders in SPY on 10/13/2014
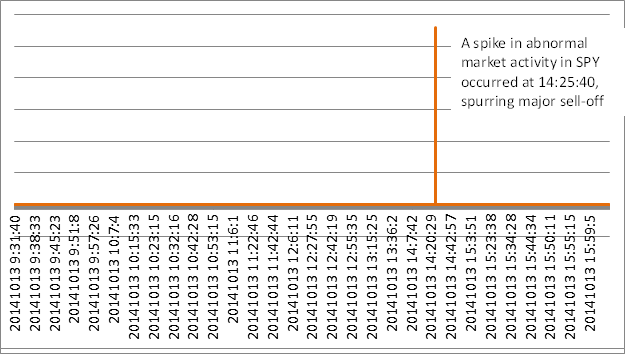
Figure 4. AbleMarkets Abnormal Trading Activity, NYSE:SPY, October 13, 2014.
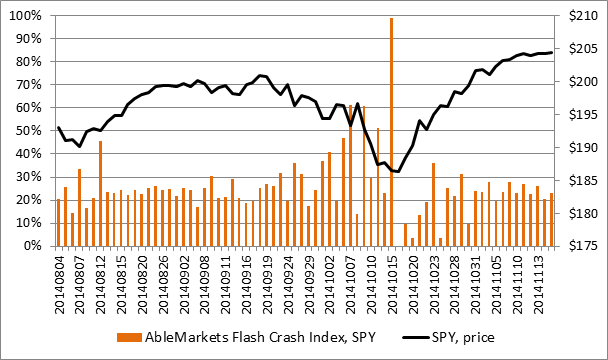
Figure 5. AbleMarkets Flash Crash Index for NYSE:SPY, covering August-November 2014.
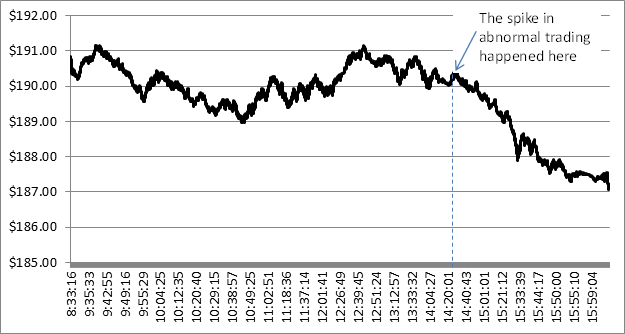
Figure 6. AbleMarkets Index of Abnormal Trading Activity in NYSE:SPY superimposed on SPY price on October 13, 2014.
Irene Aldridge and Steven Krawciw are Managing Directors of AbleMarkets, a real-time market microstructure research firm servicing regulators, institutional investors and brokers. Prior to joining AbleMarkets, Steve managed private banking products at Credit Suisse, where he conceptualized a U.S. $4-billion hedge fund feeder, while Irene was a quant on the trading floor at CIBC. Irene is the author of High-Frequency Trading: A Practical Guide to Algorithmic Strategies and Trading Systems (2nd Edition, Wiley, 2013).