The Census Bureau has recently released an important report that reveals patterns of voting and registration in the 2014 election, known as the Current Population Survey Voting and Registration Report.
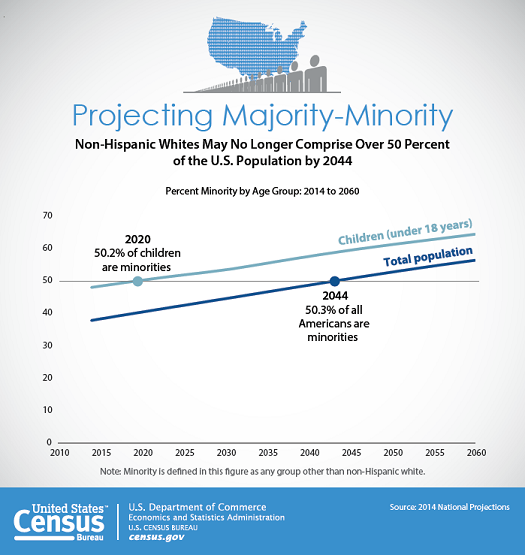
The report reveals the continued changing racial and ethnic face of America, which Census demographers project to become majority-minority by 2044. A main reason is that Whites are simply not having as many children. As soon as 2020, demographers project the country's children will be majority-minority.
Children are not yet voters, so it will take a while for the electorate to become majority-minority. But the decline of Whites in the electorate is already apparent. The Census Bureau reports the non-Hispanic White share of the electorate decreased 1.2 percentage points between 2010 and 2014.

The decrease in the White share of the electorate is all the more remarkable when you consider that White turnout decreased the least from 2010 to 2014. Minorities tend to vote at comparably lower rates than Whites in lower turnout elections (this is why a comparing 2014 to 2010 is better than comparing 2014 to 2012). Minority participation was particularly depressed in 2014 since the nation experienced the lowest turnout rate since the 1942 midterm election.
The Census Bureau reports the non-Hispanic White turnout rate among citizens of voting age decreased 2.8 points from 2010 to 2014, the non-Hispanic Black turnout rate decreased 3.2 points, and the Hispanic turnout decreased 4.2 points. The turnout rate for the "Other" category (not pictured) -- Asian, Pacific Islander, and Native Americans - decreased 4.3 points. Yet, the Black share of the electorate increased 0.3 points, Hispanic share increased 0.4 points, and Others increased 0.5 points -- all at the expense of non-Hispanic Whites, whose share of the electorate decreased 1.2 points.
Of further interest is how the turnout gap between Whites and Blacks narrowed in the 2010 and 2014 elections, elections where President Obama was not on the ballot. In 2008 and 2012, Black turnout rates exceeded White turnout in a presidential election for the first time in the history of surveys. Studies find that voting is a habit, and it thus seems reasonable that although African-American voting enthusiasm will wane in the absence of Obama on the ballot, their turnout rates will not revert all the way back to pre-2008 levels.

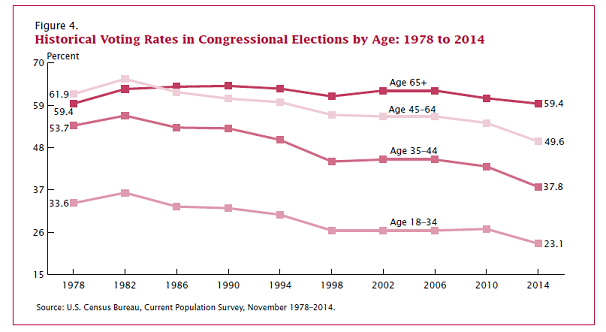
Another way to dissect the electorate is by age. Whites tend to be older than minorities; after all, demographers expect the nation's children to become majority-minority two decades before the general population. It should come as no surprise from the proceeding discussion that the oldest voters were more resistant to the lower turnout environment than younger voters. While all age groups experiences a turnout rate decline, older voters decreased the least.
These patterns of lower turnout in the 2014 midterm election will likely reverse themselves in the 2016 presidential election. Lower turnout in the 2014 election was likely a short-term aberration due to a majority of the country facing uncompetitive elections. The 2016 presidential election will be hotly contested: there is no incumbent and a record amount of money will be spent.
The Romney pollsters tricked themselves into thinking the 2012 electorate would look like the 2010 electorate, to the point of believing that they would win, even on election night. Republicans proceed at peril if they fall into that mentality in 2016. The 2016 electorate will most likely be composed of even more minorities than the 2012 electorate, and will be considerably younger than the 2014 electorate. These dynamics favor the Democrats, but they are not ironclad guarantees of victory. After all, President Bush won in 2004, but demographics are increasingly weighing against Republican candidates in presidential elections.
Even though Republicans enjoyed success in the 2014 elections, these trends will likely begin to pressure Republicans in lower turnout midterm elections, too. Even now, as the Washington Post notes, the 2014 electorate has the same demographic profile as the 2008 presidential election. That Republicans did well in 2014 despite the trends shows that demography is but one piece -- important to be sure -- of the election puzzle.
What Is the Current Population Survey Voting and Registration Report?
Every two years, the Census Bureau adds a short battery of questions on voting and registration to the November survey used to compute the nation's unemployment rate, known as the Current Population Survey or CPS. From these questions arises the Census Bureau's Voting and Registration Report. Since the federal government expends considerable resources to compute the unemployment rate, the CPS is generally considered to be a high quality survey. Unfortunately, the federal government cannot ask political questions, like which candidates people voted for. But they do ask if people are registered, if they voted, and the way they voted. As such, the CPS November voting and registration supplement is generally considered the best available snapshot of the electorate in a federal general election. The CPS is a survey and has sampling and non-sampling issues that I will explore in more detail once the Census Bureau releases the raw data.