The November BLS Non-farm Payrolls release had several strong and equally many weak points. Most discussion has centered on the large decrease in headline unemployment from 9% to 8.6%. I would suggest different areas of recent reports offer more insight. As the days since release have ticked by, the conventional wisdom regarding the data has taken a disconcerting swerve away from reality. All the data presented below is from the Bureau of Labor Statistics (BLS). All annual data is from Novembers -- to make use of the most recent data available. All quarterly data is from 3Q periods to make use of the last completed data quarter in 2011.
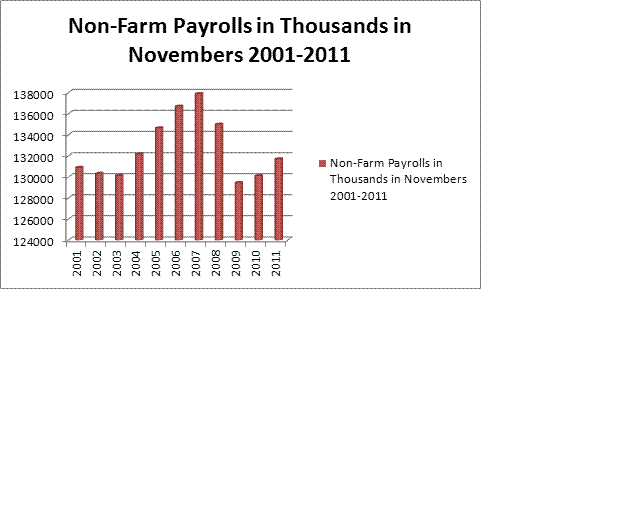
The picture that emerges is not altogether bleak and the real high points are worth mentioning. However, the payroll numbers suggest millions struggling -- unsuccessfully -- to find work. Our population is growing and our working population is shrinking. Total jobs are still well below the peak 2007 numbers.
Each month I report to you about tens of thousands of public sector workers who have lost their jobs. This month offers no exception. Across November 2011 there were 20,000 public sector job losses. This brings the 1 year total to 759,000 public sector job losses, 3.3% decline in public sector employment. Local education workers have suffered disproportionately with 450,000 job losses, over 5% of the labor force has been let go over the last year. All numbers on public sector employment are from the BLS B-1 Table.
High Points:
Previous months are being upwardly revised. This suggests the trough was less deep than previously reported. The headline unemployment number- taken from the problematic Household Survey- showed a .4 % decline, unemployment falling from 9.0 % to 8.6%. The more valuable U-6 number- including the involuntary part-time and those who gave up- fell to 15.6%. All in, November has decent and September and October 2011 were better than previously reported.
Low Points:
More people quit looking than got hired. More people got temporary holiday jobs than got real or lasting employment. Real wages continue their inexorable decline. Households are now increasing spending by dis-saving and taking on more debt. 13.3 million Americans remain unemployed. In November 120,000 net new jobs were created and 380,000 souls dropped out of the employment game.
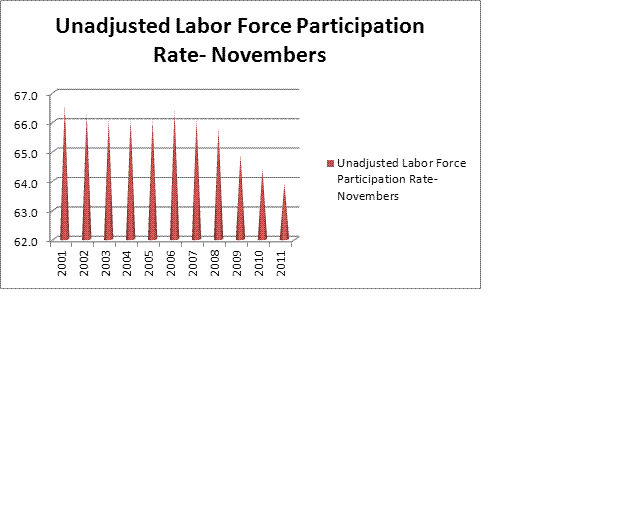
One of the under told stories of this downturn has been the steady decline in the labor force participation rate. This measures the percentage of the civilian population, over 16, that are still in the work game. These numbers include the employed and unemployed. Declines, particularly rapid declines, in this number are cause for structural concern. Here the pattern is decisively negative and worthy of far more attention than it receives.
Thus, the more robust and long term labor market indication remains negative. To this must be added that the 1Q2012 looks likely to be weak.
The Buried Lead:
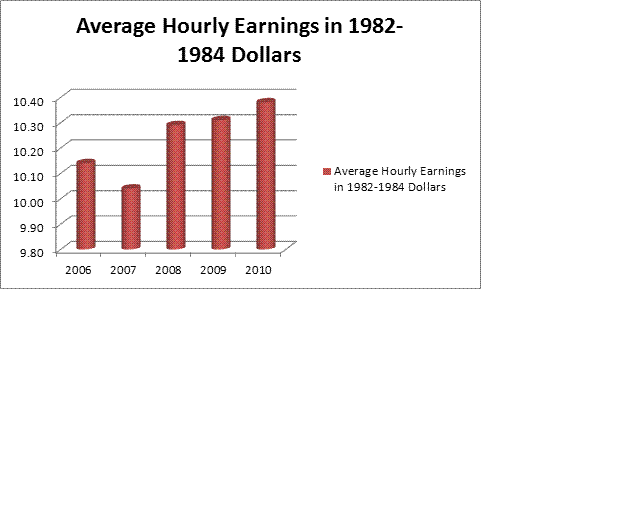
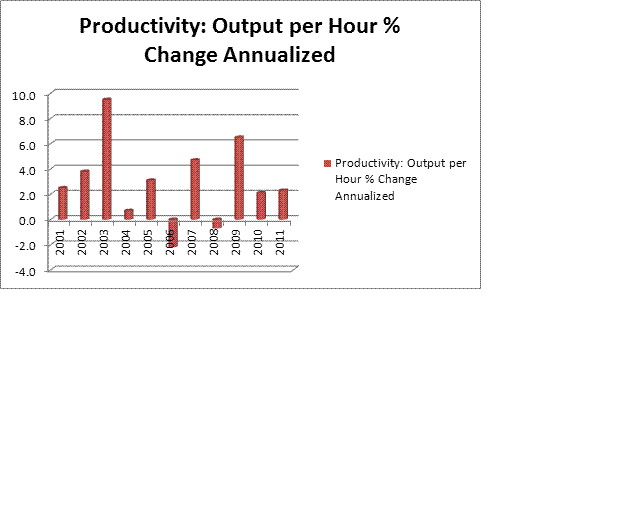
The real story is neither payrolls, nor unemployment rates. The most vital kernels of recent releases from the BLS involve productivity and real wage numbers. The news here is a story that is patently unsustainable. Average earnings, unadjusted for inflation, are going nowhere and real earnings, adjusted for inflation, have been flat or falling.
Over the last 12 months average hourly earnings have gone from $19.24 to $19.54. This is a wage increase of 1.6%. Prices have risen by about 3%. When inflation increases more than wages, we ended up poorer with the passage of time. Co-pays for healthcare are up sharply. Long story short, we continue to see the 90% of the labor force with work, losing ground. Output per hour continues to rise. This has been supportive to profits but retardant to macro recovery and political stability.
Productivity continues to rise as unit labor costs and real hourly compensation continue year-over-year and quarter-over-quarter declines. American households live on wage increases, debt increases, speculative returns and transfer payments from government. Wages are falling, debt levels are elevated and house prices continue to decline. Thus, only higher income households have a recovery that is self sustaining. As budget cutting looms in DC, states and localities continue to cut employment and services, downside risks loom.
It appears the stresses from multi-year income press are mostly seen in our increasingly polarized and bizarre national politics. This is already creating political conditions antithetical to economic growth. As services and transfer payments come under the knife, expect political polarization and tension to rise. We are nearing the end of the sustainability of rising profits and productivity with falling real wages. Ideally, wages and productivity will rise. More likely, profits will come under pressure as productivity stagnates with rising wage and political foment.


