
Why did June's unemployment report look so bad -- a net 18,000 nonfarm payroll jobs created, according to the Bureau of Labor Statistics? Well it looks like the BLS got it wrong this time. And understanding why may help to understand some of the pervading pessimism that is hurting economic growth -- both for consumers and employers. The U.S. economy has become too complex to be understood by one set of statistics -- such as the monthly jobs report. And the resulting wild swings in growth projections can only unnerve the general public -- and even decision-makers less versed in economic terms.
Some economists are scratching their heads on this one, because retail sales are growing 8 percent annually, both manufacturing and the service sector employment continues to expand, and another private payroll survey -- the ADP Report -- showed some 157,000 new private payroll jobs in June. Some of the poor report was due to Japan's earthquake-tsunami disruptions, of course. It turns out that lots of electronic as well as auto parts manufacturing was disrupted in Japan. But there's more.
It also has to do with the Bureau of Labor Statistics Seasonal Adjustment factor. That is an adjustment made to compare same month seasonal variations over several years. I.e., if hiring normally surges during June by one million new jobs (from lots of student entrants into the summer job market, for example), then the U.S. Bureau of Labor Statistics only counts the number above one million as new jobs when seasonally adjusted!
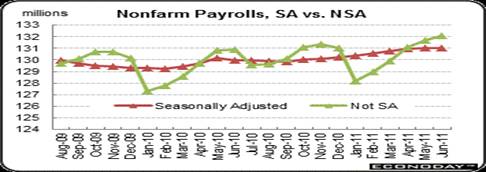
Econoday's senior economist R. Mark Rogers was one of the first to notice this anomaly. The difference, as the Econoday graph shows, is approximately one million jobs between not-seasonally adjusted vs. seasonally adjusted nonfarm payrolls. In fact, the not-seasonally-adjusted payrolls rose 376,000 in June, following a 631,000 jump in May, according to Econoday. So why not publicize that number, instead of the paltry 18,000 jobs number (57,000 private jobs created less 39,000 government jobs lost)?
Because economists in particular want to see the yr-to-yr differences in seasonal fluctuations. It is not difficult to see the problem. During the recession and soft recovery years of 2008, 2009, and 2010, the seasonal factors used by the BLS were significantly smaller -- minus 927,000, minus 949,000, and minus 927,000, because of the Great Recession. If last year's seasonal factor were used for this June's data, for instance, the overall payroll number would have been 135,000 higher and would have topped expectations, according to Dr. Rogers.
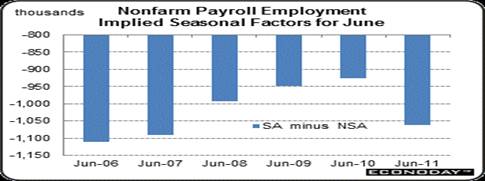
This is a serious difference. Then why were 1,060,000 'seasonal' jobs subtracted in June--a number closer to the pre-recession June 2007 level, vs. the June 2010 level of 927,000 from the actual total of new jobs? And why are seasonally adjusted numbers used for the general news reports, anyway? It is calculated with an algorithm created by the Labor Dept. The fact that, say, one million more jobs are usual in June because schools are out can mean signs of substantial growth when it happens during an economic recovery. And it is being masked by the seasonal adjustment.
Therefore, it does look like Labor Dept. economists overestimated the June job surge, which in turn underestimates real jobs growth when some sectors like housing are still in recession! And that can cause real confusion about the direction of this economic recovery -- if one isn't an economist.
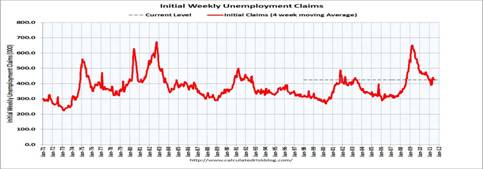
Backing up the suspicion of a faulty seasonal adjustment are the weekly initial jobless claims. They continue to fall, and would have been below 400,000 in the latest week, if Minnesota had not laid off so many state workers because of their budget standoff. This is when average weekly claims below 400,000 have historically been a sign our economy is in recovery.
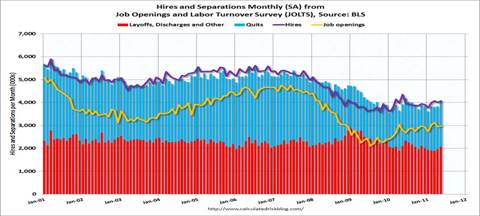
Incidentally, would it make a difference if we knew the payroll report only shows the net job creation numbers? In fact, more than four million jobs are actually lost and created every month in the U.S. It is the difference between the two that constitutes the nonfarm payroll number. The just released May BLS Job Openings and Labor Turnover Survey (JOLTS) survey shows this. Approximately two million employees were laid off in May, the last month surveyed, while two million quit their jobs. With the May seasonal adjustment (SA), a total 4,011,000 jobs were added in JOLTS (with its smaller sample amount).
And, the number of job openings in May was 3.0 million, as the Calculated Risk graph shows, unchanged from April. The number of job openings in May was 862,000 higher seasonally adjusted than in July 2009 (the series trough) yet remains well below the 4.4 million openings when the recession began in December 2007. Of course, the JOLTS report is one month behind the unemployment report
So which number do we believe? It may be necessary for economists to make such a distinction, but does that make sense to the general public? This probably means the economy is doing better than the pundits are saying, but it takes a very savvy reader to know the difference, and its certainly no confidence builder -- which doesn't help the rest of us trying to plan for the future.
Harlan Green © 2011