Mitt Romney thinks little of making a $10,000 bet because that amount means very little to someone worth hundreds of millions of dollars, just as a $10 bet means little to a typical American household. In both cases, it is merely a very small fraction of the bettor's net worth.
Likewise, when we look at the national debt of different countries, we should focus on the relative amounts of debt rather than the absolute amounts. Relative to what, you might ask? Well, that's a fair question. Often we look at the national debt divided by the GDP or some other measure of the nation's economic power. This isn't a perfect normalization (as the GDP itself is a flawed metric), but let's use it for now.
When we look at this measure of debt burden, defined as the ratio of public debt to GDP for Organisation for Economic Co-operation and Development (OECD) countries, we can see that as 2011 the OECD countries with the highest debt burden were the following (in order from most to least):
(1) Japan230.8% (Most Indebted) (2)Greece165.4% (3)Iceland130.1% (4)Italy 120.1% (5)Ireland109.2% (6)Belgium 99.7% (7)Portugal 88.0% (8)France85.5% (9)Canada83.5% (10)Germany81.5%
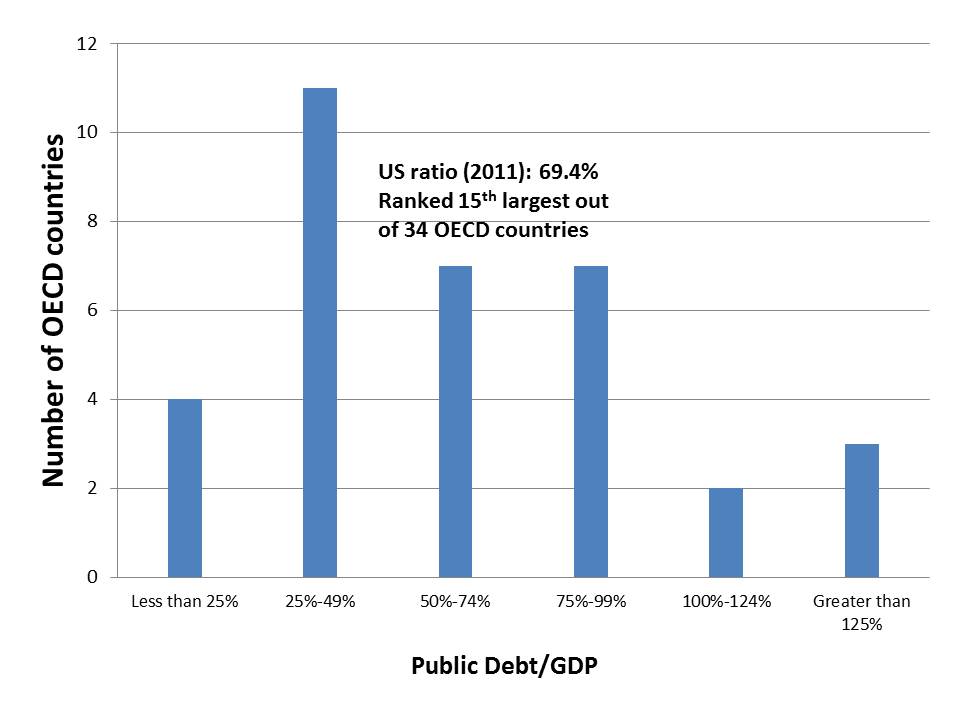
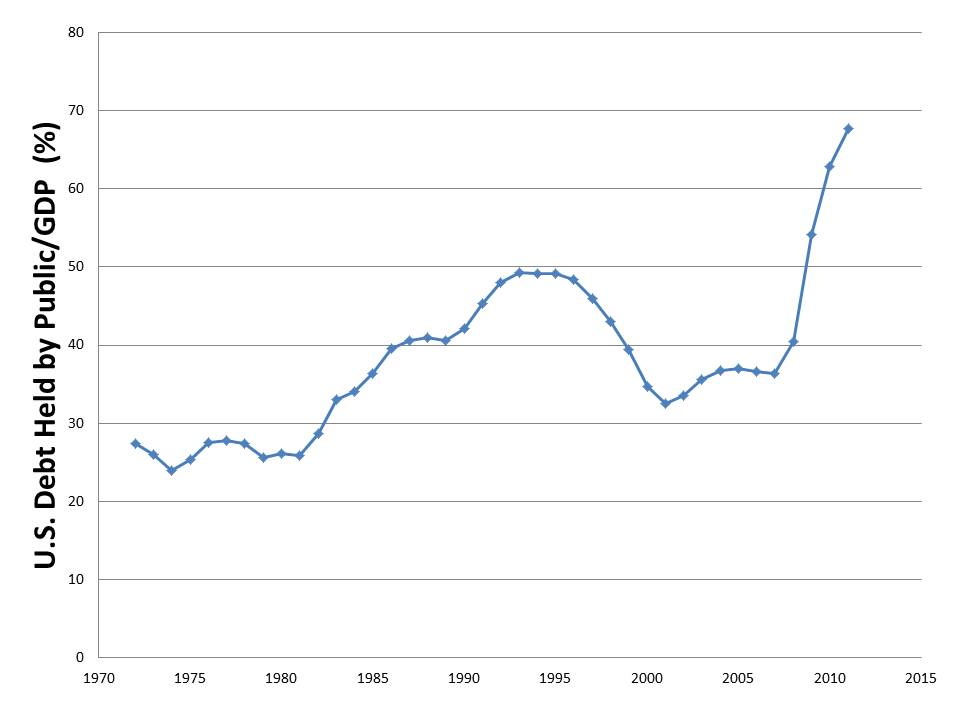
The United States had the 15th largest ratio of public debt to GDP of the 34 OECD countries. While this large debt burden in the United States is generally a cause of concern, what is more disturbing to many people is the extreme rise in this debt ratio over the last few years. This rapid rise is a combination of two simple trends, a dramatic increase in the federal government outlays coupled with declining revenues. Yes, the math is that simple, the federal government is receiving far less money from taxpayers and, at the same time, paying out a lot more.
Let's compare the time period of 2009-2011 to the time period of 1998-2001, the last time when the federal government had a surplus. In each year from 2009-2011 the federal government collected between 15.1% and 15.4% of the GDP down from the range of 19.5% to 20.6% during the period of 1998-2001. Why is the government collecting so much less now than it did a little over a decade ago? It's those tax breaks and loopholes that everyone seems to love. So it is clear that the federal government is collecting relatively less money than it did when it had a surplus, but what about its expenditures?
The federal government outlays ranged from 18.2% to 19.1% of the GDP in 1998-2001 but have been between 24.1% and 25.2% of the GDP from 2009-2011, so the government is spending more than it did during the surplus years, in both relative and absolute terms. Federal government expenditures are divided into two parts, discretionary (decided on an annual basis) and mandatory (decided by eligibility rules with some possible changes, like Social Security, Medicare, and Medicaid). I'll discuss the increases in both the mandatory and discretionary spending in separate articles but suffice to say that both have increased dramatically, for different reasons. The discretionary spending ballooned due to the wars and non-defense spending increases while the mandatory spending jumped mostly due to the economic crisis and the actions that have been taken to try mitigating the effects.
As we stare at this exploding debt burden, we are faced with serious economic and policy questions. How do we increase federal revenue in ways that don't hurt the fragile economy? How do we control federal spending without stomping on the sprouts of economic growth?
For those who are busy preaching that the government spending needs to be slashed immediately, ask yourselves how austerity measures have negatively impacted the European countries. Do you really need another data point in the long history of how austerity measures have hurt economic growth or as you hoping that "this time it is different"? For those who are busy preaching that federal debts don't matter (arguing that the federal government "owns the printing press") ask yourselves what happens to long-term economic prospects when any government becomes overburdened with debt.
In general, economists that begin analysis with their personal philosophy first and then hunt for data to support those ideas can be called many things, but they certainly cannot be called objective scientists. Politicians and voters who make decisions without taking the time to study the facts are poor stewards of the nation's future and risk damaging the country's long-term growth.
The answer to our debt burden is simple: collect more revenue and make targeted spending cuts. It's not a complicated idea, but getting politicians, economists, and voters to agree seems to be today's Gordian knot. Until someone slices through the political and economic rhetoric, many of us will keep staring at that graph of the exploding US debt and seeing a train rushing down the tracks to crush America's future.
Follow Howard Steven Friedman on Facebook
Notes: - The Organisation for Economic Co-operation and Development (OECD) is an international organisation comprised of 34 countries, representing many of the wealthier countries in the world. Its members include North American countries (Canada, Mexico and the U.S.), much of Western Europe, as well as New Zealand, Australia, Chile, Israel, Japan and South Korea. Data from the OECD is readily available online and makes for a great data source for cross-country comparisons. - Estimates of the OECD country debt burden were taken from the CIA World Factbook- Estimates of the United States federal government's debt burden over time was taken from the Congressional Budget Office