
Appropos of nothing in the news, I wanted to share a figure from some forthcoming work on the benefits of full employment, benefits that are sorely lacking from our persistently slack job market (data courtesy of Heidi Shierholz of the Economic Policy Institute).
When the job market really tightens up, at least two good things tend to occur for less affluent working families: they find more hours of work at higher hourly wage rates. And the least well-off benefit the most.
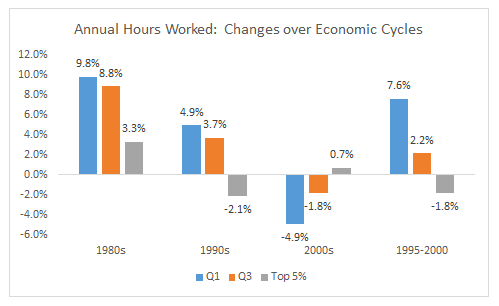
The figure below focuses on the first "good thing." It shows the percent change in hours worked in the paid labor market over three different business cycles, the 1980s (1979-89), the 1990s (1989-2000), and the 2000s (2000-07) by low, middle, and high-income households. EPI sums up labor supply within each household, so that a household with a full-time worker (about 2,000 hours per year) and a half-time worker would count as 3,000 hours in the labor market. The last set of column breaks out the unique period of moving to full employment-1995-2000-a period I've often emphasized as a living example of the benefits of truly tight labor markets.
Putting aside the uniquely weak 2000s recovery for a moment, the other sets of bars show that the hours worked by lower income households increased slightly faster than those with middle incomes, while high income households gained the least. To be clear, that's not because the wealthy households are lazy. To the contrary, they're already maxed out, with annual household hours around 4,000, implying two full-time, full-year workers and at least in this regard, they're pretty insulated from recessions.
The experience in the 2000s make my point in reverse: in weak job markets, those at the low end get hit the hardest. And visa-versa, as the economy move towards full employment in the 1atter 1990s, the predicted gradient is particularly clear, as seen in the more elastic response in hours worked by the least well off households.
One is remined that in our current job market there are about 12 million unemployed and 8 million part-timers who want but can't find full-time work. Doing the math-let's see... carry the 9... that's about a gazillion hours of lost labor, missing output, and for many, family hardship.
This post originally appeared at Jared Bernstein's On The Economy blog.