
This post originally appeared on Liberty Street Economics.
On October 29, superstorm Sandy hit the tri-state area, flooding streets, highways, tunnels, buildings, and homes, and crippling the region's public transit system. At least 94 people in New York and New Jersey were killed. Downed power lines and damaged transformers plunged downtown Manhattan and coastal areas into days and weeks of darkness. The damage is still being assessed, but costs are sure to be in the tens of billions. Schools were no exception to this devastation, both in infrastructural damage and in disruptions to students' education. The storm shut down all 1,750 New York City public schools for a full week, and many remained closed, damaged, or were relocated in the following week. A few schools will not return to their normal locations until 2013. In this post, we analyze the impact of Sandy on New York City schools and assess how the storm might affect students' educational outcomes.
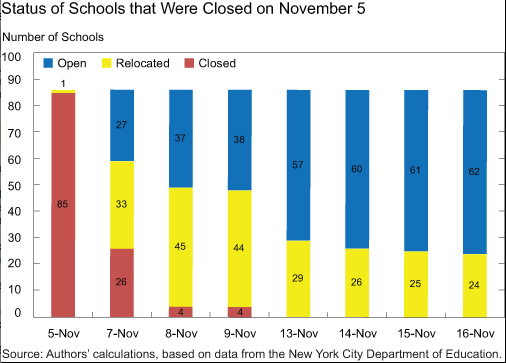
Widespread power outages and transportation challenges left New York City little choice but to close all schools in the first week after the storm. At the start of the second week, on November 5, most of the city's schools reopened in their normal locations, although many lacked heat. Eighty-six schools, however, remained closed. As the week progressed, these schools either reopened or, if too damaged, relocated to temporary locations. The chart below shows the status of this group of schools in the second and third weeks following the storm. We see by the middle of the second week that all schools were open, if not in their usual locations, and some displaced schools were progressively returning to their original sites. Some schools remain displaced, with the New York City Department of Education (DoE) estimating a return in January.
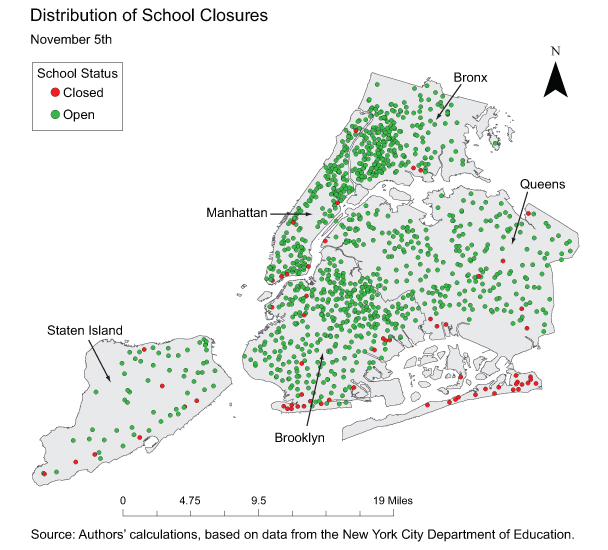
There was a wide spatial variation in the schools that were affected. The map below shows the distribution of school openings and closures on November 5. The extended closures largely followed the path of Sandy, with effects most strongly concentrated in the Rockaways, Coney Island, and downtown Manhattan, where the storm hit the hardest.
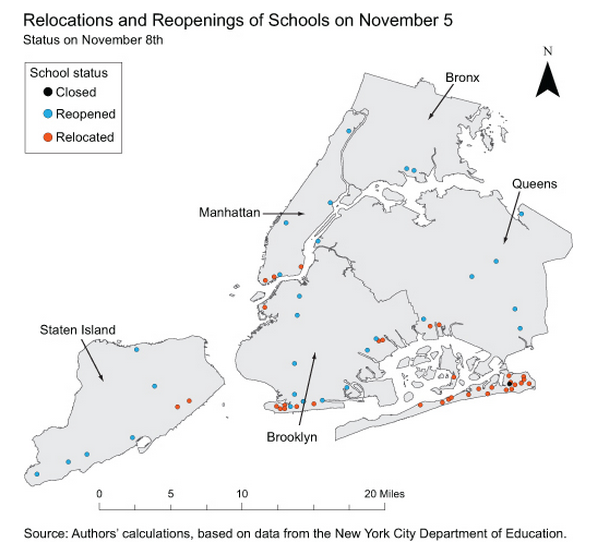
The next map focuses on the schools that were closed on November 5 and their status on Thursday, November 8. Notice the substantial variation in how these closed schools recovered. Schools in the hardest-hit areas are also taking the longest to recover, and many had to be relocated to temporary locations. In contrast, many schools in less hard-hit areas that had been closed reopened in their original locations in the days that followed.
Although the displaced schools represent a small percentage of the total number of schools, the challenges of relocation impose a heavy burden on the students and teachers forced to move, the schools accepting the displaced, and on the DoE as it coordinates the relocations. The system does not have a large buffer of empty schools or seats, so finding a place to send over 20,000 students is no simple task. In addition, transportation was limited (particularly in the areas from which people were being relocated), making it difficult for parents to send children to their new school location. Busing was only available to a portion of the student population. Because the DoE transportation hub for a time lacked electricity, it couldn't incorporate the additional routes, so buses had to transport the relocated students after running their original routes, causing many students to miss portions of the school day.
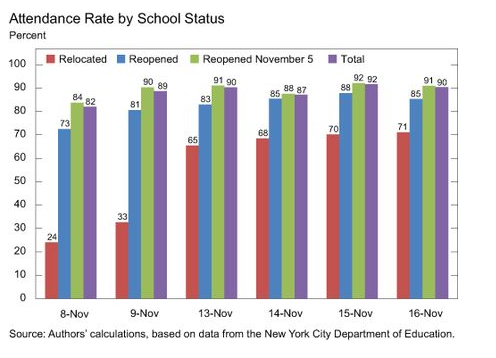
While school closures get the most publicity, they don't tell the whole story. Attendance rates paint an even bleaker picture, and show that the impact of Sandy wasn't limited to schools that were late in reopening. The chart below shows attendance rates in the different groups of schools in the second and third weeks after the storm. "Reopened November 5" refers to the group of schools that opened again on the first day that schools were back in session. The schools that remained closed on November 5 are divided into two groups below based on their status in the following days as "relocated" schools or "reopened" schools. Attendance rates vary greatly across these groups. While the attendance rates in the schools reopening on November 5 were highest, they still lagged behind their average on regular days (91 percent). The schools reopening later and especially the relocated schools had considerably lower attendance rates, at least in the second week. For example, the attendance rate of the relocated schools was below 33 percent, while their average rate in the pre-Sandy period was around 91 percent. Given the difficulties for children in badly affected areas in getting to any school, much less an unfamiliar one in a far away location, the attendance rates for affected schools were very low in the past couple weeks. The gap began to close as time progressed, although the attendance rates for the displaced schools are still around 20 percentage points lower than the city's average. What both the closure data and the attendance data show is that aggregate statistics hide the severe problems that a small percentage of schools and students still face.
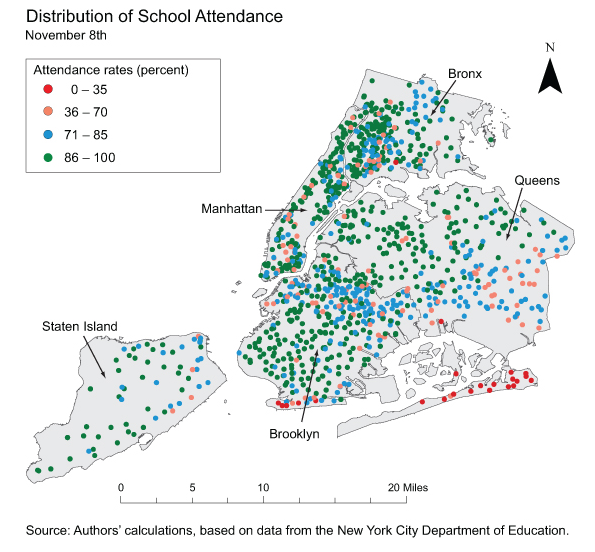
There was also spatial variation in how attendance rates recovered. As the map below shows, attendance rates were the lowest in the Rockaways and Coney Island -- the areas with the most damage and disruption. Nonetheless, there was a large variation in attendance in schools across New York City, and low attendance rates plagued schools in all of the city's five boroughs.
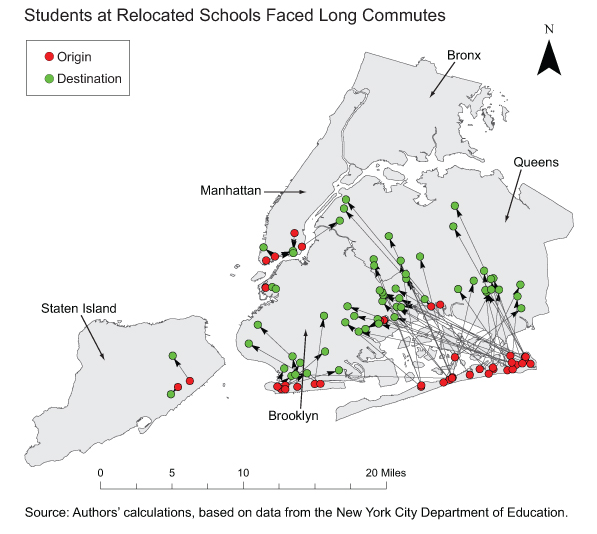
Perhaps the most important reason behind the abysmally low attendance rates in the relocated schools is the long commutes of these students. As the next map shows, some students were relocated to schools halfway across the city or in different boroughs. These treks would be difficult under normal circumstances; with the public transportation system in recovery and the school bus coordination in disarray, it is no wonder the relocated schools had such low attendance rates.
Longer-Term Impact
A difficult question that New York City schools faced, along with other schools in the region, was whether to make up the lost time, and if so, how. Schools Chancellor Dennis Walcott has announced an agreement with the teachers union to cancel three vacation days in February and convert a half day in June into a full day to make up for some of the time.
After the dust settles and schools resume their normal activity, many may wonder how the disruptions from Sandy might affect student performance. There could be effects simply from the lost days of school. Research shows that missing school days has negative effects on student learning and performance. The evidence suggests that an additional day of schooling improves test scores by between 0.013 and 0.039 standard deviations. So, the school days lost due to Sandy (two days, once the make-up time is factored in) could potentially lower test scores by anywhere between 0.026-0.078 standard deviations, with a larger effect expected for the schools that stayed closed into the second week. (To put this effect into perspective, we note that a one-third reduction in class size was found to increase test scores by about 0.22-0.28 standard deviations.) The city plans to make up three and a half days, which should mitigate some of the negative impact of time lost due to Sandy.
Simply getting kids into classrooms, though, doesn't solve the other problems caused by the storm that might affect student learning. It's doubtful that students in displaced schools and those in the host schools are receiving their usual level of education. Overcrowding, long commutes, and the additional effort required of staff are major challenges. Moreover, psychological impacts are likely to be faced by all students, especially those in the hard-hit areas. It's difficult to imagine students being able to fully concentrate in class when their families are homeless or without power or food. This problem cannot be solved by restoring the schools alone. It's also directly related to helping the families recover and rebuild, both physically and psychologically -- a process that will likely take considerably longer.
Disclaimer: The views expressed in this post are those of the authors and do not necessarily reflect the position of the Federal Reserve Bank of New York or the Federal Reserve System. Any errors or omissions are the responsibility of the authors.