By Matt Knutzen, Geospatial Librarian - The New York Public Library
One hundred years ago, a building-sized elephant stood across the street from the Coney Island Cyclone. The "elephant bazaar," which once occupied the area on the North side of Surf Avenue, was an exciting discovery for The New York Public Library's Lionel Pincus and Princess Firyal Map Division, which, with the aid of a generous three-year grant from the National Endowment for the Humanities (NEH), is busy transforming NYPL's historical paper map and atlas collections into a powerful digital resource.
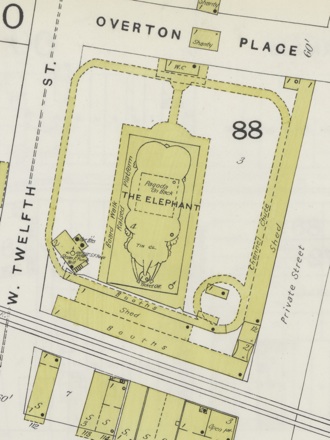
"Brooklyn Vol. B Plate No. 175 [Map bounded by Stillwell Ave., Overton Place, W. 10th St.]." The New York Public Library, Lionel Pincus and Princess Firyal Map Division. Digital ID 1808916.
Digitizing the old maps -- in this initial stage, primarily detailed insurance and real estate atlases of New York City -- is only the beginning of a multi-step process that turns map images into actual geographical data. Imagine Google Maps, but with a "go back in time" option. Here's how it works:
- Maps are scanned and converted to high resolution digital images;
- The images are georectified (or more colloquially, "rubber-sheeted," or "warped"): a process that involves aligning the pixels on an old map to the latitude/longitude on a virtual map;
- The warped maps are then cropped to remove extraneous non-map information (such as page borders);
- Finally, map data (such as building footprints or ward boundaries) are traced and transcribed into open, exportable formats.
All of the above work is carried out by a combination of Library staff and public volunteers through a web-based toolkit affectionately dubbed the "Map Warper". The NYPL Map Warper website includes a how-to instruction video, along with a detailed georectification guide. There are also instructions on map cropping, a necessary step in the creation of map mosaics. (See Unbinding the Atlas: Working with Digital Maps for more information on this process.)
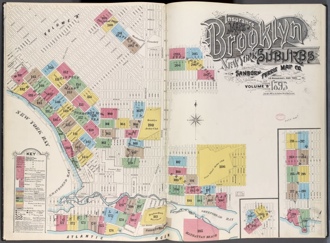
"Insurance Maps of Brooklyn New York Sanborn Perris map co. 113 Broadway, New York. Volume 'B' 1895." The New York Public Library, Lionel Pincus and Princess Firyal Map Division. Digital ID 1808871.
If the project's current pace continues at this rate, the Library anticipates more than 17,000 historical maps will be digitized, most of which concentrate on the five boroughs, with significant coverage of upstate New York and New Jersey as well. The scanned maps can be found in a number of places, starting with a chronological list of atlases arranged by borough in The Library's Digital Gallery. For example, one of the atlases highlighted here (Insurance Maps of Brooklyn New York), features a graphically rich index page illustrating a Brooklyn that has yet to fill in the projected urban grid.
Once the maps are scanned, they are georectified using the Map Warper. With the help of our patrons, the Library has made great progress in georectifying New York City maps, warping about 2,400 sheets from approximately 162 atlases.

A collage of some of the georectified map layers from the project, including William Perris's Maps of the City of New York (1857-1862); G.W. Bromley's Atlas of the City of New York, Borough of Queens... (1909); the Bronx Topographical Survey's Topographic Survey and New Street System of the Borough of the Bronx... (1905); G.M. Hopkins's Detailed Estate and Old Farm Line Atlas of the City of Brooklyn (1880); and G.W. Bromley's Atlas of the City of New York, Borough of Richmond, Staten Island (1917).
After georectification comes map tracing, and this is where the proverbial rubber meets the road in working with historical maps. This type of data will eventually allow you to ask your phone a question, such as, "I'm standing in front of the Coney Island Cyclone -- what other attractions would I see if I was here 100 years ago?" (Answer: The afore-mentioned Elephant Bazaar.) If map warping involves preparing digital image pixels of old maps to relate to one another geospatially, map tracing involves preparing data to be harvested, mined, analyzed, mashed, and made part of the "Semantic Web" to connect related data across time. As with warping the maps, the Map Division would love the assistance of our users in helping us expand this trove of historical footprints. The Library's digitization guide to map tracing is available to help the public learn more. (At the bottom of this post, there are a few screenshots and links illustrating how we're starting to play with visualizing some of this data in Google Maps.)
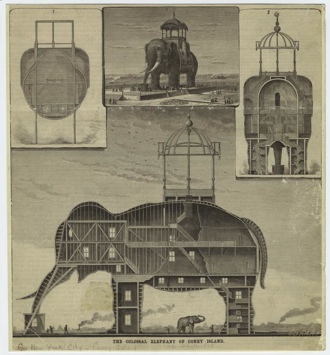
"The colossal elephant of Coney Island (1885)." The New York Public Library, Mid-Manhattan Picture Collection. Digital ID 801320.
The large majority of maps we're working with in this project are fire insurance maps, which were designed to give insurance adjusters a reasonable metric to assign fire insurance values to buildings. This was accomplished by documenting, among many other things, each building structure's street address, construction materials (e.g. wood, brick, etc.), and property height (in stories), as well as the location of fire hydrants and the general location and width of water mains (to gauge available water pressure levels at each hydrant location). The goal of the project is to trace from a series of atlases all of the buildings' spatial footprints, and then transcribe all of the accompanying feature data. The ability to search this data as searchable (i.e. machine readable) information breathes new life into these wonderful historical documents by expanding their use in a wider, linked-data universe.
If you're interested in learning more, please visit the Map Division, located in the Stephen A. Schwarzman Building at Fifth Avenue and 42nd Street, or join us for a Citizen Cartography workshop.
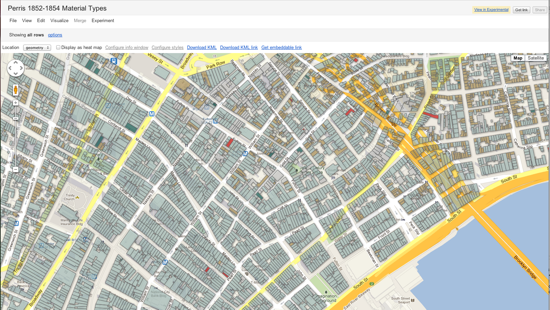
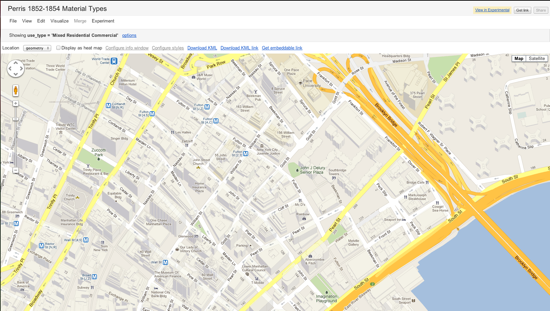
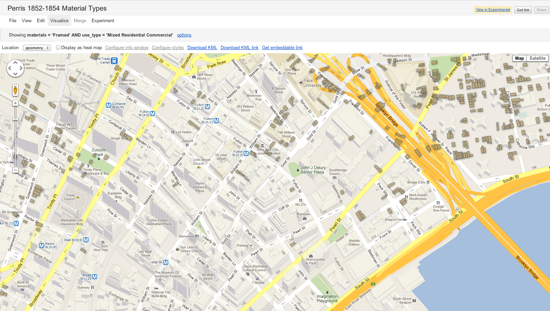
The three images featured here show a set of building footprint data derived from William Perris's first edition Maps of the City of New York, published in a 98-sheet, seven-volume series between 1852-1854. The data was traced at maps.nypl.org, and cleaned-up using regular expressions and the Google Refine tool. The resulting data was then loaded into Google Fusion tables, where it was stylized. The first image shows the map data from the Perris atlas, its color based on the attributes in the "material type" field. The second image, derived from the same data, is filtered to show only buildings that are Mixed Use (residential and commercial), and buildings where small business people lived -- sole proprietors -- either in a back apartment or upstairs, who ran some sort of business from home. The third image, also derived from the same data, is filtered to show only Mixed Use buildings that are framed (wooden). This type of filtering, along with the potential for analyzing building data, is a powerful and dynamic way to explore and understand the historical city. And this type of methodology, i.e. moving paper, analog collections from the material to the digital world and then making them machine readable, queriable, linkable, and generally more intelligent and more than the sum of their parts, is at the core of this project and many others in the wider world of digital scholarship.
This is a modified version of an original post made at NYPL Blogs.